
TL;DR
Supply chain analytics turns data from ERP, WMS, TMS, and supplier systems into decisions. Supply chain visibility is the outcome when those decisions can be made in time to matter.
The bottleneck is rarely missing data. It is fragmented meaning: the same SKU, supplier, or "on-time" defined differently in every system.
Governing everything equally is the most common and most expensive mistake. Brambles' operating principle (“not all data is equal”) is the corrective.⁸
Four global supply chains converged on the same five moves: outcome first, narrow scope, explicit meaning, activation inside existing tools, and changes to reporting lines and cadence.
Start agents where skilled people spend most of the day assembling information before they can decide. That returns time to the expert rather than replacing them.
Not long after the 2023 holiday break and the launch of ChatGPT, a supply chain executive at a global technology hardware manufacturer got a question from his boss that most supply chain analytics leaders have now heard some version of: can't we just open all our data up to this thing?
His first instinct was that yes, surely that's how it works. Then he thought it through. These are language models. The language of his company is specific. How would a model know what the business means by a demand plan? What a booking is, or a sales order, or a customer segment in their context?
That question is the real state of supply chain analytics in 2026. Most enterprises do not have a data shortage. They have a meaning shortage, and it is why so much analytics and AI investment fails to change a single operational outcome.
What is supply chain analytics?
Supply chain analytics is the practice of collecting, integrating, and analyzing data from across sourcing, planning, manufacturing, logistics, and fulfillment to improve how a supply chain performs. In mature programs it also includes the governance layer that makes that data trustworthy enough to act on.
Definition: Supply chain analytics is the discipline of combining operational, transactional, and external data across the supply chain — and the metadata that gives it shared meaning — to produce decisions about inventory, sourcing, production, and delivery.
The second half of that definition is what most industry content omits, and it is where programs succeed or stall. A dashboard built on three conflicting definitions of "on-time delivery" is not analytics. It is an argument with charts.
What is the difference between supply chain analytics and supply chain visibility?
Analytics is the capability. Visibility is the result. Analytics processes the data; visibility is what a planner, buyer, or logistics leader actually has when analytics is fed trustworthy, commonly defined inputs fast enough to act.
The distinction matters commercially. Logistics platforms sell signal: shipment telemetry, predictive ETAs, carrier events, multi-tier mapping. That signal is necessary, and most large enterprises now have plenty of it. What they lack is agreement on what the signal means once it makes contact with data from a different system. Gartner's own analysis of AI-powered supply chain orchestration describes this as assembled across multiple planning, visibility, and analytics tools rather than delivered by any single platform, and names inconsistent data from trading partners as a constraint in its own right.² Adding a tenth feed to a network where "supplier" resolves four different ways only produces faster disagreement.
Definition: Supply chain visibility is the ability to see the current and likely future state of materials, inventory, and orders across the network, with enough confidence in the underlying data to make a decision without re-verifying it.
What are the four types of supply chain analytics?
Type | Question it answers | Example output | Data prerequisite |
Descriptive | What happened? | On-time delivery by carrier last quarter | Consistent event definitions across sources |
Diagnostic | Why did it happen? | Root cause of a forecast bias in one region | Lineage, so you can trace a number to its origin |
Predictive | What is likely next? | Stockout risk by SKU and location over 6 weeks | Reliable history and stable master data |
Prescriptive | What should we do? | Recommended reorder points and alternate sourcing | Documented business logic and decision rules |
A fifth category (cognitive or agentic analytics, where systems recommend and also act) is now where most investment is heading. It carries a much higher data-trust bar, for reasons covered below.
Why do most supply chain analytics initiatives fail to deliver ROI?
Most initiatives fail because they add analytical capability on top of data of unresolved meaning. The technology works, but the inputs are ambiguous, unowned, and unverifiable, so the output cannot be trusted enough to change a decision.
The pattern shows up in the analyst data. In August 2026, Gartner reported that 55% of chief supply chain officers were unclear on the return from their AI investments, even though 67% of supply chain digital investment now goes to AI.¹ The two figures come from two different studies: the investment-allocation number from a survey of 394 supply chain professionals at organizations with at least $250 million in revenue, fielded between November 2025 and February 2026, and the ROI finding from a separate survey of 135 senior supply chain leaders conducted from January through April 2026.¹
A separate Gartner survey of 140 senior supply chain leaders, published in May 2026, found only 17% pursuing immediate transformational redesign of processes and workflows, with 83% applying AI incrementally or scaling it gradually.²
Spend is high, conviction is low, and operating models are largely unchanged. That is what a foundation problem looks like from the top of the org chart.
Why can't you just point an AI at your supply chain data?
Because supply chain systems encode company-specific meaning that a model cannot infer from the data alone. Terms like demand plan, booking, allocation, and customer segment carry definitions particular to one business, and a model given raw access will produce fluent answers built on the wrong assumptions.
Simply put: the model does not understand the business just because you point it at a data lake. Enterprise AI needs context, governance, and shared business meaning.
The analysts land in the same place. Gartner attributes the constrained progress of AI orchestration to foundational master data alignment problems that technology alone cannot resolve, and points to process maturity and standardized data models as prerequisites for effective decision governance.²
Models and algorithms get the headlines, but without well-documented metadata they amount to noise. At LIPTON Teas and Infusions, Global Director of Data & AI Robin Rietveldt puts it as a dependency: AI cannot function without having a good understanding of the context, which is precisely the role metadata plays.⁹
The five failure patterns of supply chain analytics
Supply chain analytics fail in a number of ways. Five of them account for most of it, and most large supply chains are running at least three right now, usually without calling any of them a data problem.
System silos. ERP, WMS, TMS, MES, and supplier portals hold overlapping data that never reconciles, so every cross-functional question requires manual assembly.
Semantic drift. Definitions diverge quietly over years. Two teams report different numbers for the same metric and both are internally correct.
Ungoverned critical data. Nobody owns the handful of fields that everything depends on, so quality problems surface as decisions, not as alerts.
Orphaned dashboards. Reports get built for one request, then persist unowned and unmaintained until no one trusts any of them.
AI on undocumented data. The most expensive pattern, because an agent does not surface a bad definition. It acts on it.
The order matters: silos create drift, drift makes ownership ambiguous, and ambiguity lets dashboards and agents inherit definitions nobody chose. Which is why "fix the data" is the wrong remedy; it's unbounded, and it never finishes.
Why does supply-chain visibility break down?
Visibility breaks down beyond the direct supplier boundary because enterprise systems typically only map the data flows within a contractual relationship (Tier 1). So while purchase orders, SRM records, and onboarding data are mapped, external data flows (Tier 2) are invisible by default.
In McKinsey's 2025 supply chain risk pulse, 95% of respondents reported visibility into at least Tier-1 supplier risk — but among those, that visibility extended to Tier 2 or beyond for only 42%.³ The survey covered 100 companies. As a result, Gartner puts the share of supply chains that can execute decisions in real time at 7%, against 95% that must react quickly to change.⁴
A third figure sharpens the point. QIMA's 2026 Global Sourcing Survey, covering more than 1,000 businesses, found the average business now maps 60% of its supplier network, up from 53% — yet only 18% report full end-to-end visibility.⁵ (QIMA supplies inspection and compliance services, so treat this as its own survey data rather than neutral market research.) The gap between the mapping figure and the visibility figure is key: knowing who is in your network is not the same as being able to trust what your systems say about them.
Those numbers describe two different problems; Tier 2-4 blindness is partly a data access problem, as suppliers treat their own upstream networks as proprietary, and McKinsey found that while 58% of respondents have mapped their Tier-2 suppliers, fewer than half of those maintain regular direct contact with them.³
Real-time execution, by contrast, is a data trust problem: the data exists internally but nobody can act on it fast enough without verifying it first. The first requires external mapping and supplier collaboration. The second is entirely within your control, and it is the cheaper of the two to fix.
What data do you actually need for real-time supply chain visibility?
You need operational data from the systems that run the supply chain, external signal for risk and demand context, and a metadata layer that makes them interoperable. The third item is what most programs skip and later rebuild.
Which systems hold supply chain data?
ERP — purchase orders, inventory positions, financial transactions
WMS / MES — warehouse movements, production events, quality results
TMS and carrier feeds — shipments, milestones, predictive ETAs
PLM — bills of materials, component specifications, engineering changes
Supplier portals and EDI — ASNs, confirmations, lead times
IoT and telematics — asset location, condition, cold-chain integrity
External — weather, port congestion, geopolitical and credit risk, POS and market demand
Individually, these are well understood. The difficulty is that a single planner question — can we still hit the commit on this order? — touches five of them at once, each with its own identifiers and refresh cadence.
What are critical data elements, and how do you prioritize them?
Critical data elements are the specific fields that the business genuinely cannot function without. By prioritizing them, leaders can avoid the most expensive mistake in supply chain governance: trying to govern everything to the same standard.
Brambles is a useful case because of its scale. The company moves roughly a third of a billion platforms across about 60 countries, with 750 service centres, IoT devices generating billions of data points, and a domain structure running to hundreds of sub-subdomains.⁸ Governing all of that uniformly is not achievable at any budget.
Alistair Griffin, Global Data Governance Lead at Brambles, describes their approach as radical prioritization, built on the principle that ”not all data is equal."⁸ His team plots data volume against the effort and cost of managing it: a wide base of data needing minimal oversight, narrowing to an apex of critical data elements that justify real investment. Griffin's test for the apex is specific: data that reduces serious risk, produces new income, or is required to operate as a business, such as regulatory data.⁸
That economic framing has unlocked executive sponsorship. It reframes governance from an open-ended cost to a targeted investment, and it’s survived contact with the CEO: asked at a town hall what would differentiate the company over the coming years, he named data governance as one of two answers.⁸
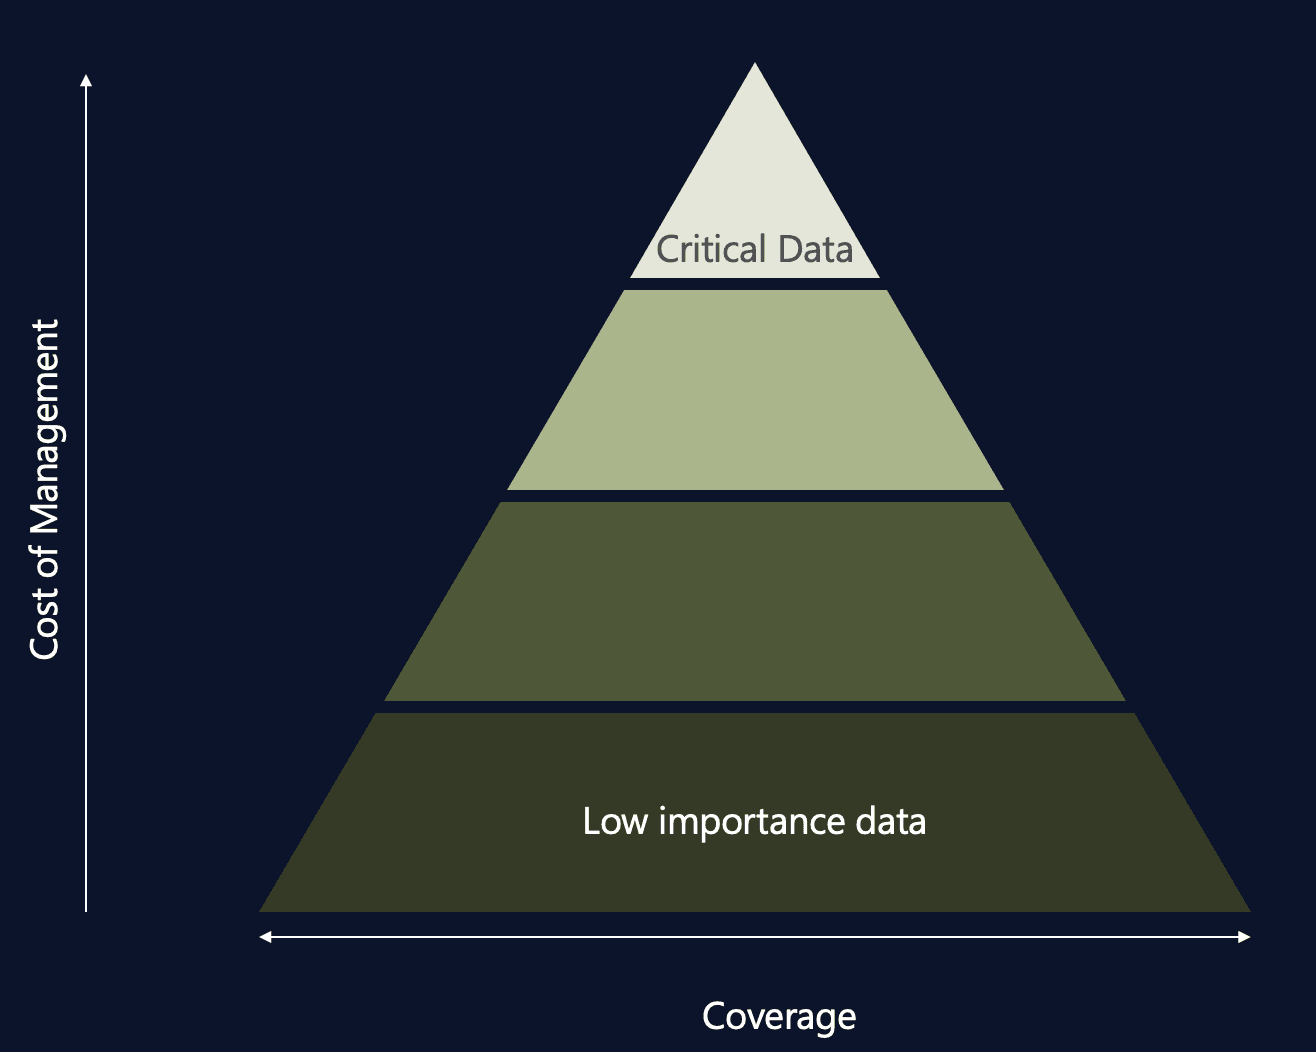
Manual CDE programs rarely survive this scale, which is the practical constraint most governance leaders hit. Griffin's team found that connecting a single ERP source brought roughly 300,000 objects into scope, a volume no team reviews by hand, and one Griffin expected to contain substantial duplication.⁸ That is the real problem with manual approaches: the work does not just exceed capacity, much of it is spent on records that should never have been reviewed separately. Automating that discovery and linkage, in their case with Alation CDE Manager, is what turned the principle into an operating practice rather than an aspiration.
What is a supply chain data product?
A supply chain data product is a curated, governed, reusable dataset built for a specific business decision, with documented ownership, lineage, and quality expectations attached.
The practical difference from a report is reuse. A shipment feed built once can serve customer service, carrier performance review, and an AI agent without three separate integration efforts. Common examples include inventory optimization datasets, supplier performance and risk scorecards, logistics visibility feeds, and demand forecast outputs. Our guide to supply chain data products covers the anatomy of each, and the data product lifecycle covers how they are maintained once live.
Critical data elements and data products are related but distinct: CDEs are the high-priority ingredients, and data products are the finished dishes. If a SKU identifier is unreliable, every product built on it inherits the problem.
How are global supply chains actually solving this? Five patterns
Four global supply chains across tea, heavy-duty trucking, circular-economy logistics, and technology hardware arrived independently at the same five moves. None of them started by buying more visibility feeds.
Pattern 1: Start from the business outcome, not the catalog
Every one of these programs began with a specific operational pain, not a completeness goal. Rietveldt's four-pillar framework at LIPTON makes the sequence explicit: value creation first, then use cases, then the data foundation, then the operating model.⁹ Every initiative ties to a measurable business outcome before it starts.
His stated lesson is that it is easy to simply start curating a catalog, and far better to listen to what people actually need.⁹ The hardware manufacturer's leader gives the same advice in the negative: work from the outcome down rather than the capability up, and do not catalog everything while waiting for opportunity to emerge.
Pattern 2: Narrow the scope before scaling it
Brambles narrows by governing the apex of the pyramid rather than the whole estate.⁸ The hardware manufacturer narrows differently but with the same logic, building what its team calls utility agents: tightly scoped agents for a single domain and a single task, rather than general-purpose AI.
The shared instruction, stated in some form by all four: do not boil the ocean. Build the branches as you go.
Pattern 3: Make meaning explicit before adding intelligence
This is the pattern that separates these companies from the market narrative. All four invested in documenting what their data means (leveraging glossaries, lineage, ownership, business context) as a precondition for analytics and AI rather than a cleanup exercise afterwards.
The path to this is a metadata management practice treated as infrastructure, not paperwork. In practice that means a data catalog that captures business meaning alongside technical structure, and semantic consistency enforced across domains so that a term means one thing everywhere it appears.
Pattern 4: Activate inside the tools people already use
None of these programs asked users to adopt a new destination. LIPTON pushes Alation metadata into the front page of its Power BI reports, so source, refresh schedule, and key metrics appear where analysis already happens.⁹ The hardware manufacturer's demand planners stopped checking dashboards for forecast deviations and started receiving proactive alerts, with root-cause analysis available through simple prompting.
Rietveldt's phrasing for this is to meet users where they are.⁹ The corollary is unglamorous but reliable: adoption is a distribution problem more often than a quality problem.
Pattern 5: Change reporting lines and cadence, not just tooling
This is the pattern the market discusses least, and the one with the clearest analyst support behind it.
Gartner reaches it from the ROI side. Its August 2026 research argues that returns depend on a "rightsized" change management strategy that explicitly links change execution to AI strategy and enterprise priorities, and predicts that by 2030, organizations that rightsize change management this way will achieve twice the ROI on AI initiatives compared with those relying on legacy methodologies.¹ In other words, the variable that separates AI spend from AI return is organizational, not technical.
The practitioners got there first. The hardware manufacturer ended what its leader calls the analytics corner, with data science teams working adjacent to the business, building dashboards for whoever asked. Data science now reports directly to transformation leaders inside planning, sourcing, and manufacturing, combined with business architecture and process ownership. The stated effect was that teams worked on problems the business actually needed solved.
Brambles built accountability into the structure: the executive leadership team acts as data owners, with 31 VPs responsible for data stewardship beneath them.⁸ LIPTON runs an annual, quarterly, and monthly review rhythm to keep priorities aligned, and Rietveldt treats curation as a permanent daily habit rather than a project with an end date — closer to making the bed than to a migration.⁹
How do you turn fragmented supply chain data into real-time visibility?
Seven steps, in order. Each maps to something these four companies actually did, and each has a test for whether it is finished.
Pick one decision that is currently slow or wrong. Not a domain but a decision. "Whether we can hold the commit date on at-risk orders." Done when: a named business owner agrees this decision matters and will use the result.
Trace the decision back to its data. Identify every system a person touches today to answer it manually, and how long that takes. Done when: you can name the sources and the current cycle time.
Declare the critical data elements underneath it. Usually a handful of fields — SKU, supplier, location, promise date. Apply the risk/revenue/regulation test. Done when: each has a named owner and a documented definition.
Resolve the definitions. Where two systems disagree, force a decision and record it. This is the step organizations skip and the one that determines whether anything downstream is trustworthy. Done when: one definition is published and the exceptions are documented.
Package it as a data product. Ownership, lineage, refresh cadence, quality expectations, and a place people can find it — a data products marketplace rather than a shared drive. Done when: a second team can use it without talking to the first.
Deliver it where the work happens. Embed in the BI tool, the planning system, or an alert. Done when: the intended user gets it without changing tools.
Instrument adoption and outcomes. Track who uses it, for what, and whether the original decision improved. Done when: you can report the outcome, not the output.
Then repeat. Every one of these companies built incrementally, use case by use case.
Where should you start with supply chain AI agents?
Start where skilled people spend most of their day assembling information before they can make a decision. At one global technology hardware manufacturer, leaders identified roles where most of the day went to collecting and analyzing data ahead of the actual judgment call. That pre-work is the strongest first candidate for an agent, because removing it returns time to the expert rather than replacing them.
Role | Pre-work an agent can absorb | Judgment that stays with the person | Data product required |
Demand planner | Comparing plan to actuals across dashboards and exports; locating where bias sits | Deciding what the deviation means and how to correct it with the business unit | Booking or forecast attainment dataset |
Supply planner | Monitoring inventory positions and supplier lead-time variance for early warnings | Choosing between expediting, resourcing, or reallocating | Inventory position and supplier performance feed |
Buyer / category manager | Assembling supplier performance, risk exposure, and spend history | Negotiating, qualifying alternates, managing the relationship | Supplier performance and risk scorecard |
Logistics coordinator | Watching milestones and exceptions across carriers and modes | Deciding which exceptions justify cost to fix | Shipment and predictive ETA feed |
Factory / quality engineer | Retrieving procedures, schematics, and historical failure patterns | Diagnosing the novel case; changing the process or design | Production and test result history |
One example makes the pattern concrete. At the hardware manufacturer, a unit that fails a test on the line normally comes off and sits idle — sometimes for hours — until a debug engineer can disposition it, which is a direct throughput bottleneck. A troubleshooting agent now guides the operator in real time using the schematic, the test procedure, and historical failure data. The unit stays on the line, and the engineer is freed for higher-order work like design changes. LIPTON built toward the same first use case independently: a frontline system letting operators query systems and access instructions the moment a machine fails.⁹
The reliable tell for a good first use case is that the people doing the work want it. The hardware manufacturer's demand planners were not defensive — they were experienced analytics practitioners who had used causal AI for years, and their reaction to losing the data-gathering work was enthusiasm for the time it returned to conversations with the business.
Which supply chain analytics KPIs actually matter?
The KPIs worth instrumenting are the ones with a named owner and a traceable data dependency. A metric nobody owns and nobody can trace back to source will not survive its first challenge in a review meeting.
KPI | What it reveals | Typical owner | Data dependency |
OTIF (on-time, in-full) | Whether commitments to customers hold | Fulfillment / logistics | One agreed definition of "on time" across systems |
Perfect order rate | End-to-end execution quality | Supply chain operations | Order, shipment, and returns data joined reliably |
Forecast accuracy / MAPE | Planning quality and bias direction | Demand planning | Clean history plus stable product master data |
Inventory turns | Working capital efficiency | Supply chain finance | Consistent inventory valuation and location hierarchy |
Cash-to-cash cycle time | How long capital is tied up | Finance / supply chain | Reconciled procurement, inventory, and receivables data |
Supplier lead-time variance | Where upstream risk actually sits | Procurement | Supplier master data with resolved duplicates |
Time to detect | How fast you learn about a disruption | Supply chain operations | Event data with reliable timestamps |
Time to detect deserves more attention than it gets. It is the metric that most directly measures visibility, and it is usually the easiest to improve without new feeds — because the delay is typically verification, not acquisition.
How do AI agents change supply chain analytics?
Agents shift analytics from reporting to execution, and in doing so they raise the data-trust bar substantially. A dashboard with a bad definition produces a number a human might question. An agent with a bad definition takes an action.
That is why the companies furthest along treat governance as the enabling condition rather than the brake — and why the analysts now say the same thing in their recommendations rather than their caveats. Gartner's March 2026 guidance to CSCOs building toward autonomous disruption management puts data quality and governance investment first, so that autonomous technologies can reach accurate, timely and complete supply chain information and produce decisions that can be trusted and defended against emerging regulatory expectations.⁶ Governance is not what slows the agent down. It is what makes the agent's output usable.
As the hardware manufacturer's leader puts it: if your agents draw on data that isn't trusted, your agents won't be trusted.
What does a "utility agent" look like in practice?
A utility agent is scoped to one domain and one task, grounded in a governed data product, and delivered into an existing workflow. The demand planning example is representative: a specific data product for booking attainment, an agent that proactively flags deviations from forecast, and root-cause analysis available to the planner through prompting instead of manual comparison.
Grounding agents in trusted metadata is the difference between a demo and a deployment. Where Alation's own product surface is relevant here, it is for that reason: Agent Studio exists so agents inherit governed definitions and documented business logic rather than improvising them, and the Data Quality Agent exists so quality assessment scales without adding to a steward's workload. Neither is interesting on its own. Both matter because an untrusted agent is an unused agent, and unused agents are where the ROI in that Gartner survey went missing.
Where should a human stay in the loop?
Keep humans on any decision that commits money, changes a customer promise, or alters a supplier relationship. Agents are well suited to detection, assembly, summarization, and recommendation. They are not yet suited to unilaterally committing the business.
Gartner draws the boundary in the same place. Even while predicting that 60% of supply chain disruptions will be resolved without human intervention by 2031, it advises that current technological immaturity and data availability issues should for now restrict full automation to low-risk decisions, with AI used to augment human judgment on higher-stakes calls where full automation would introduce unacceptable risk.⁶
Two practical boundaries drawn by these companies point the same way: automation does not remove responsibility for process quality — if the underlying process is weak, no agent repairs it, and a strong process is what AI can scale.⁸ And trust is earned incrementally, as teams see agents reflect their expertise accurately.⁸ That sequence cannot be skipped by mandate.
Frequently asked questions
Do you need a data catalog for supply chain analytics? Not for a single report. You need one as soon as more than one team consumes the same data, because that is when conflicting definitions start producing conflicting numbers. A data catalog is where definitions, ownership, and lineage live so a planner can trust a figure without re-deriving it.
What is the difference between a control tower and a data product? A control tower is a monitoring interface. A data product is the governed dataset underneath it. Control towers struggle when they are built directly on unreconciled sources — the display improves while the underlying disagreement remains. This is the failure mode Gartner describes at the category level when it notes that orchestration depends on data quality and that many organizations struggle with foundational master data alignment that technology alone cannot fix.² A better screen does not resolve a definitional conflict.
How long until supply chain analytics shows ROI? A single scoped use case can show measurable improvement in one to two quarters if the decision is narrow and the data owner is engaged. Enterprise-wide transformation takes years. The programs that report early wins deliberately sequence for them, because credibility is what funds the next phase.
Can you do this without replacing your ERP? Yes, and replacing it rarely solves the problem. Fragmentation is usually about definitions and ownership rather than platform count. A new ERP with the same undocumented meaning produces the same conflicting reports on a newer stack.
Who should own supply chain data — IT or the supply chain function? Business functions should own the data; IT should own the platform. The most effective structure observed here embeds data science and analytics capability inside planning, sourcing, and manufacturing, reporting to those transformation leaders, with accountability held at executive level and stewardship distributed to named VPs.
What is the difference between master data management and metadata management here? MDM governs the values — one authoritative record per supplier, product, or location. Metadata management governs the meaning, ownership, and lineage around those values. Supply chain analytics needs both; programs typically invest in the first and discover they needed the second.
How do you measure the ROI of supply chain visibility? Measure the decisions, not the dashboards. Time to detect a disruption, time from detection to decision, expedite and premium freight spend avoided, forecast bias reduction, and analyst hours returned to judgment work are all defensible. Attributing broad cost savings to a visibility platform generally is not.
Is agentic AI ready for supply chain execution? It is ready for detection, assembly, and recommendation inside scoped domains, which is where these four companies deployed. Autonomous commitment of spend or customer promises is not there yet — and both these practitioners and Gartner attribute the constraint to data trust and process quality rather than model capability.⁶
What are critical data elements in a supply chain context? The specific fields the business cannot operate without: SKU and product identifiers, supplier and site identifiers, location hierarchies, promise and commit dates, and lot or serial numbers where traceability is regulated. CDEs enable data leaders to surface the most high-value data to govern and analyze. Alation's guide to critical data elements covers how to identify and govern them.
The through-line
The market narrative says supply chain visibility is a coverage problem: more feeds, more sensors, more tiers mapped. The four companies here suggest something less comfortable. They did not begin by acquiring signal. They began by deciding which data mattered, making its meaning explicit, and delivering it where people already worked — then changed reporting lines and review cadences so the discipline held.
This is an operating decision, and it is available to any organization willing to pick one slow decision and fix the data underneath it.
If you are working through this, Alation's guide to supply chain data products covers the five highest-value products to build first, and the Data Products Blueprint covers the operating model around them. To see how the Alation AIOS platform supports this, start a conversation.
Sources & notes
Every external claim on this page is independently verifiable. The public sources are listed here, and we encourage you to check them.
55% of chief supply chain officers unclear on the ROI of their AI investments (survey of 135 senior supply chain leaders, January–April 2026); 67% of supply chain digital investment allocated to AI (survey of 394 supply chain professionals at organizations with $250M+ annual revenue, November 2025–February 2026); prediction that organizations rightsizing change management will achieve twice the AI ROI by 2030. — Gartner, Gartner Survey Finds Majority of Chief Supply Chain Officers Unclear on AI Investment Returns, 5 August 2026 ↗ https://www.gartner.com/en/newsroom/press-releases/2026-08-05-gartner-survey-finds-majority-of-chief-supply-chain-officers-unclear-on-ai-investment-returns
17% of supply chain organizations pursuing immediate transformational redesign of processes and workflows, 83% applying AI incrementally or scaling it gradually (survey of 140 senior supply chain leaders, fielded November 2025); orchestration described as assembled across multiple planning, visibility and analytics tools rather than a single vendor platform; data gaps, inconsistent trading-partner data, foundational master data alignment and process maturity named as constraints. — Gartner, Gartner Survey Shows AI is Not Driving Supply Chain Operating Model Transformation, 6 May 2026 ↗ https://www.gartner.com/en/newsroom/press-releases/2026-05-06-gartner-survey-shows-ai-is-not-driving-supply-chain-operating-model-transformation
95% of respondents report visibility into at least Tier-1 supplier risk, extending to Tier 2 or beyond for only 42% of them; 58% have mapped their Tier-2 suppliers, but fewer than half of those report regular direct contact with them. Survey of 100 companies. — McKinsey & Company, Supply chain risk pulse 2025: Tariffs reshuffle global trade priorities, 2 December 2025 ↗ https://www.mckinsey.com/capabilities/operations/our-insights/supply-chain-risk-survey
95% of supply chains must react quickly to change; 7% can execute decisions in real time. — Gartner, Future of Supply Chains 2026 ↗ https://www.gartner.com/en/supply-chain/topics/future-of-supply-chain
18% of businesses report full end-to-end visibility; average supplier-network mapping at 60%, up from 53%. Survey of more than 1,000 businesses with international sourcing networks. QIMA provides inspection, audit and compliance services. — QIMA, 2026 Global Sourcing Survey: From Disruption to Opportunity ↗ https://www.qima.com/whitepaper/2026-global-sourcing-survey
Prediction that 60% of supply chain disruptions will be resolved without human intervention by 2031; recommendation that full automation be restricted to low-risk decisions for now given technological immaturity and data availability issues, with AI augmenting human judgment on higher-stakes decisions; recommendation that CSCOs prioritize investment in data quality and governance so autonomous technologies can access accurate, timely and complete information. — Gartner, Gartner Predicts 60% of Supply Chain Disruptions Will Be Resolved Without Human Intervention by 2031, 18 March 2026 ↗ https://www.gartner.com/en/newsroom/press-releases/2026-03-18-gartner-predicts-60-percent-of-supply-chain-disruptions-will-be-resolved-without-human-intervention-by-2031
Reserved — see reviewer note on the anonymized hardware manufacturer story below.
Alistair Griffin, Global Data Governance Lead, Brambles: "not all data is equal"; criticality test of serious risk reduction, new income, or requirement to operate such as regulation; scale of roughly a third of a billion platforms across ~60 countries, 750 service centres, and a domain structure of 10 domains, 31 subdomains and ~323 sub-subdomains; Executive Leadership Team as data owners with 31 VPs responsible for stewardship; ~300,000 objects surfaced on connecting a single ERP source, expected to contain substantial duplication; CEO naming data governance at a town hall as one of two differentiators. — Alation, How Brambles Uses CDEs to Govern Its Global Supply-Chain Data, 16 December 2025 ↗ https://www.alation.com/blog/how-brambles-uses-cdes-to-govern-supply-chain-data/
Robin Rietveldt, Global Director of Data & AI, LIPTON Teas and Infusions: "AI cannot function without having a good understanding of the context"; four-pillar framework of value creation, use cases, data foundation and operating model; annual, quarterly and monthly review drumbeat; lesson that it is easy to start curating a catalog but better to listen to what people need; meeting users where they are by feeding Alation metadata into Power BI report front pages; frontline system enabling operators to query systems and access instructions when a machine fails; curation as a never-ending habit. — Alation, How Lipton Is Brewing a Smarter Supply Chain with Alation, 24 November 2025 ↗ https://www.alation.com/blog/lipton-smarter-supply-chain-with-alation/
Analyst Attributions & Disclaimers
Gartner, Gartner Survey Finds Majority of Chief Supply Chain Officers Unclear on AI Investment Returns, 5 August 2026. Gartner, Gartner Survey Shows AI is Not Driving Supply Chain Operating Model Transformation, 6 May 2026. Gartner, Gartner Predicts 60% of Supply Chain Disruptions Will Be Resolved Without Human Intervention by 2031, 18 March 2026. Gartner, Future of Supply Chains 2026.
Gartner does not endorse any vendor, product or service depicted in its research publications and does not advise technology users to select only those vendors with the highest ratings or other designation. Gartner research publications consist of the opinions of Gartner's research organization and should not be construed as statements of fact. Gartner disclaims all warranties, expressed or implied, with respect to this research, including any warranties of merchantability or fitness for a particular purpose. GARTNER and Magic Quadrant are registered trademarks and service marks of Gartner, Inc. and/or its affiliates in the U.S. and internationally and are used herein with permission. All rights reserved.
- AI
- Data Catalog
- Data Governance
- Data Products
- Digital Transformation
- Data Quality
- Modern Data Stack
Keep reading
More from the data desk