PRODUCT · ALATION ANALYTICS
Prove your
data program works.
Alation Analytics measures adoption, curation, compliance, and consumption across your full data estate. Every metric is drawn from inside the catalog, where the signals live.
An external dashboard can measure what gets exported. Alation Analytics measures what actually happens. Ask in plain language and get evidence that the foundation is getting stronger, not just older.
WHY IT MATTERS
You invested in the foundation. You can't prove its impact.
The board asks whether the data program is delivering, and you have anecdotes. Meanwhile the catalog is already recording the answer across your entire data estate, but nobody's querying it.
Measurable progress
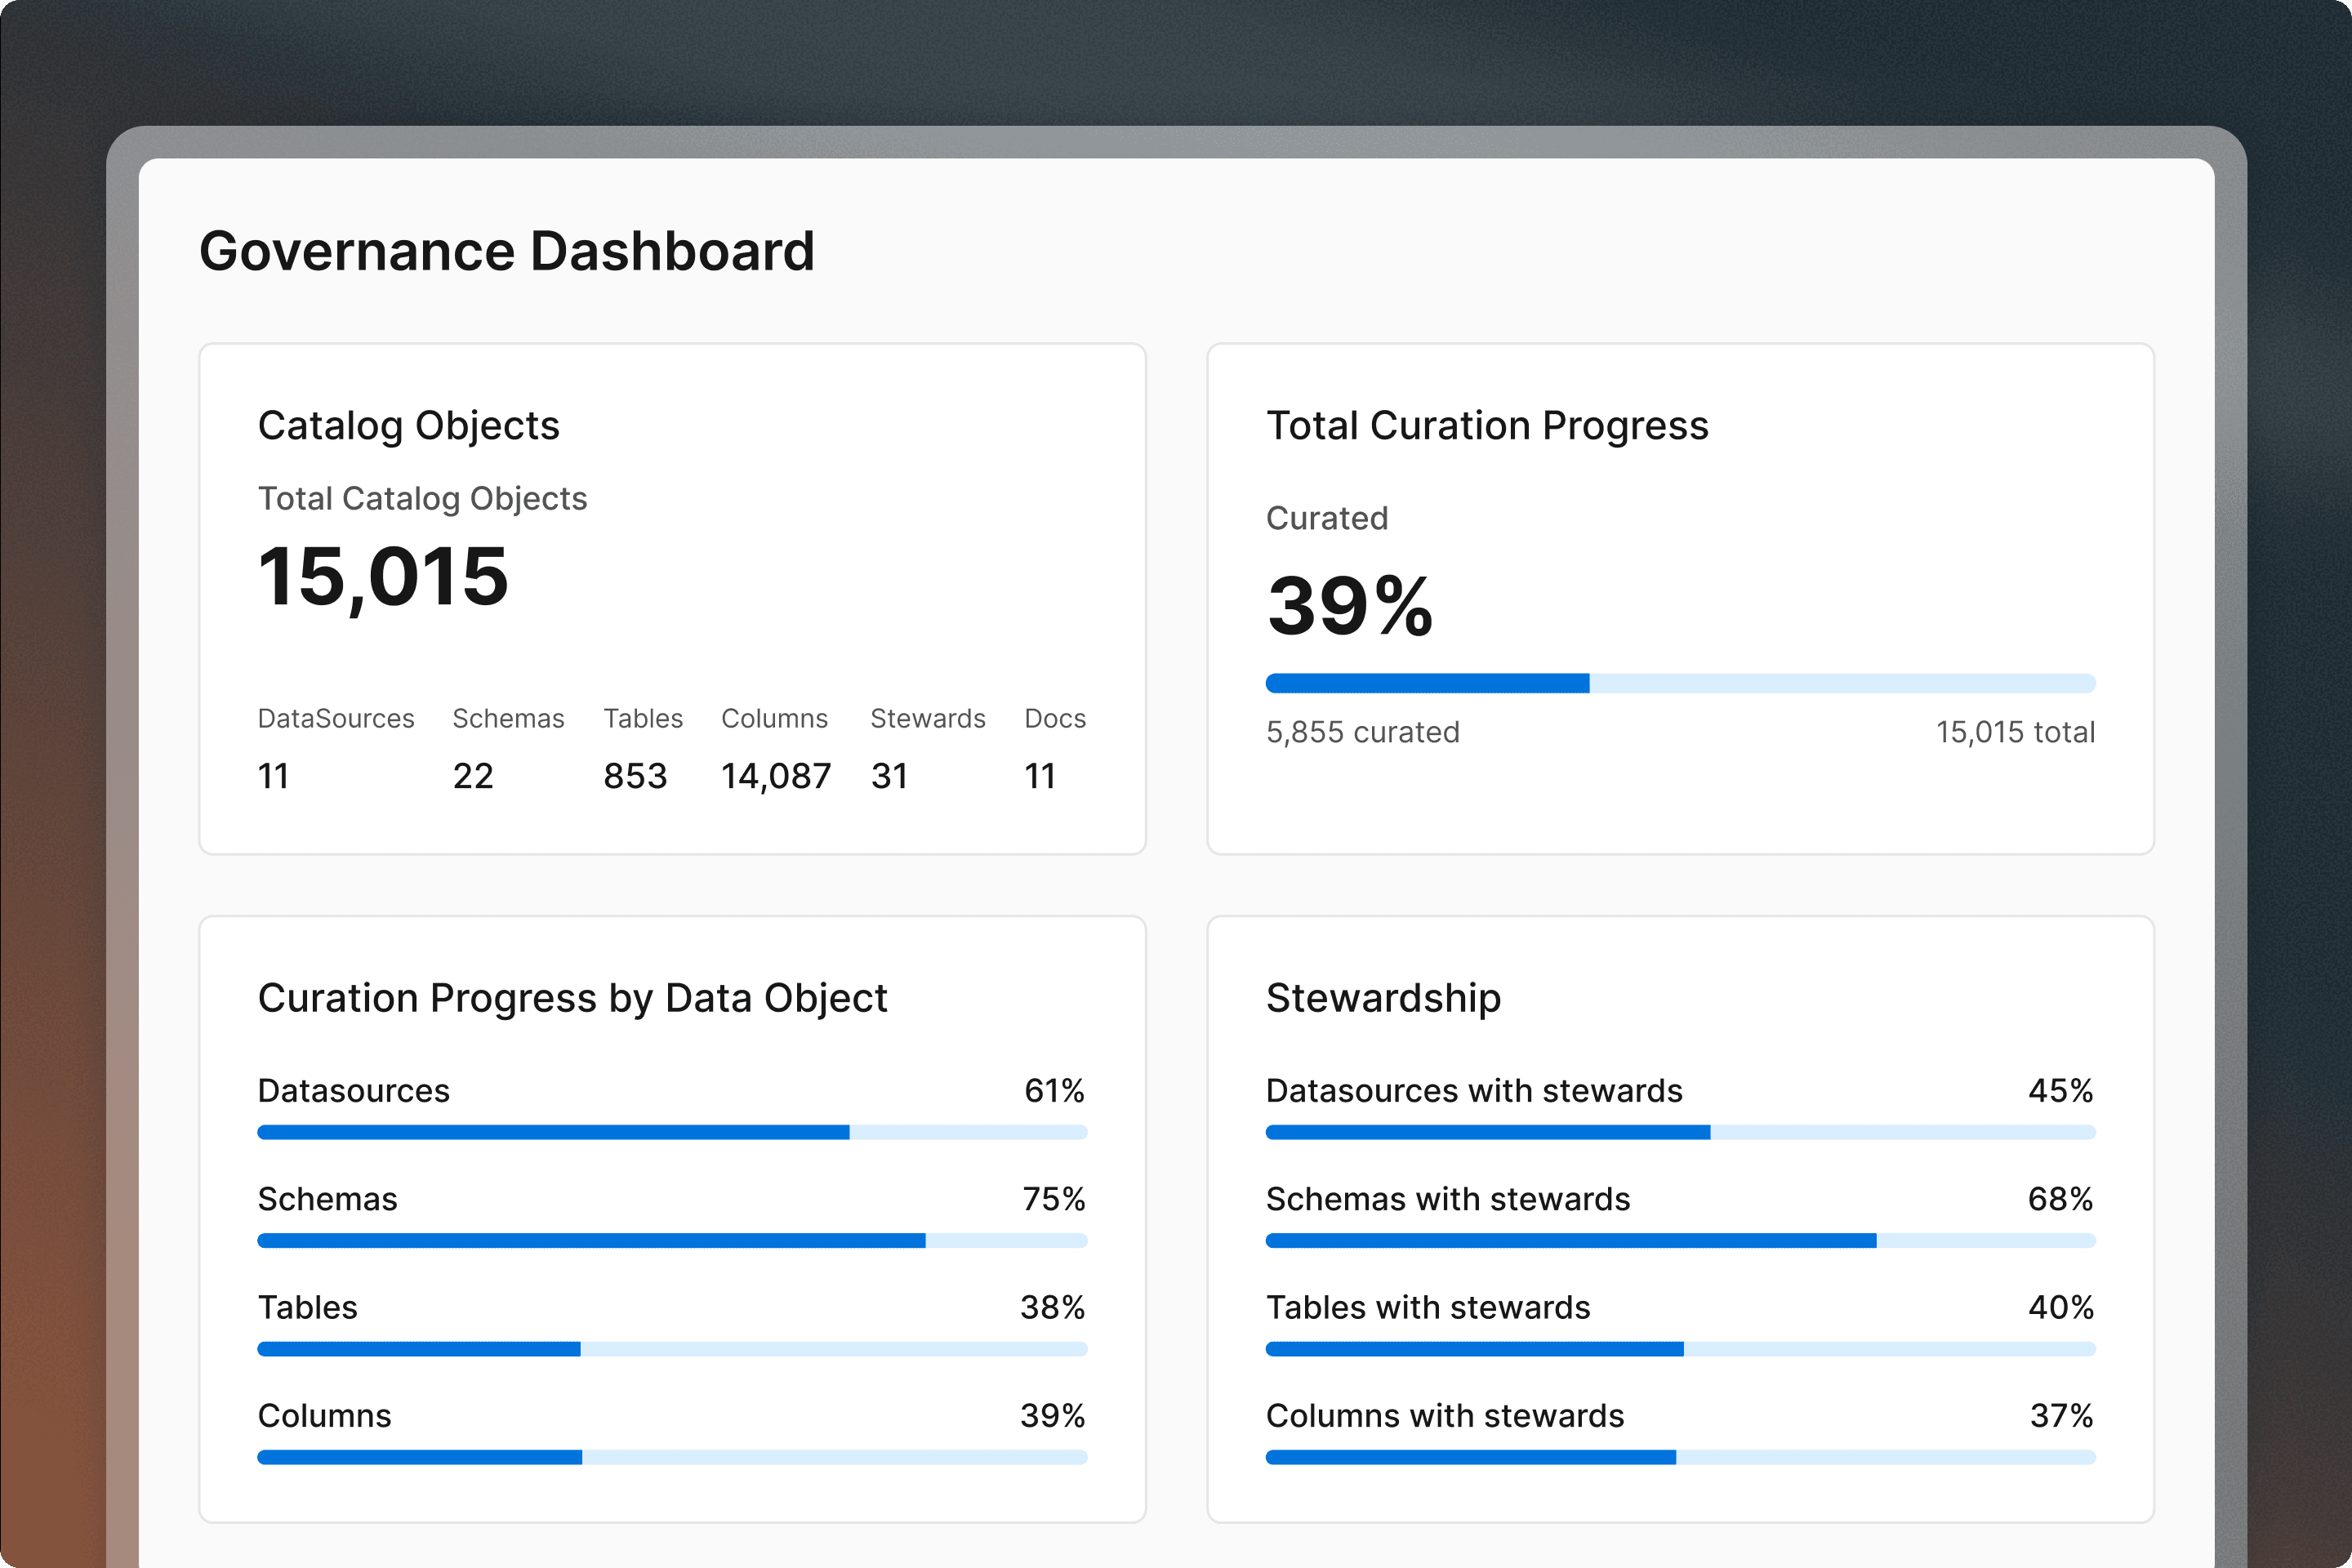
Instantly see who uses the catalog, how often, and for what purpose. Track completeness by data domain, steward activity, and metadata quality over time. Measure whether curation, quality, and adoption are improving quarter over quarter. Spot under-adopting teams while there's still time to fix it.
Get every high-value signal
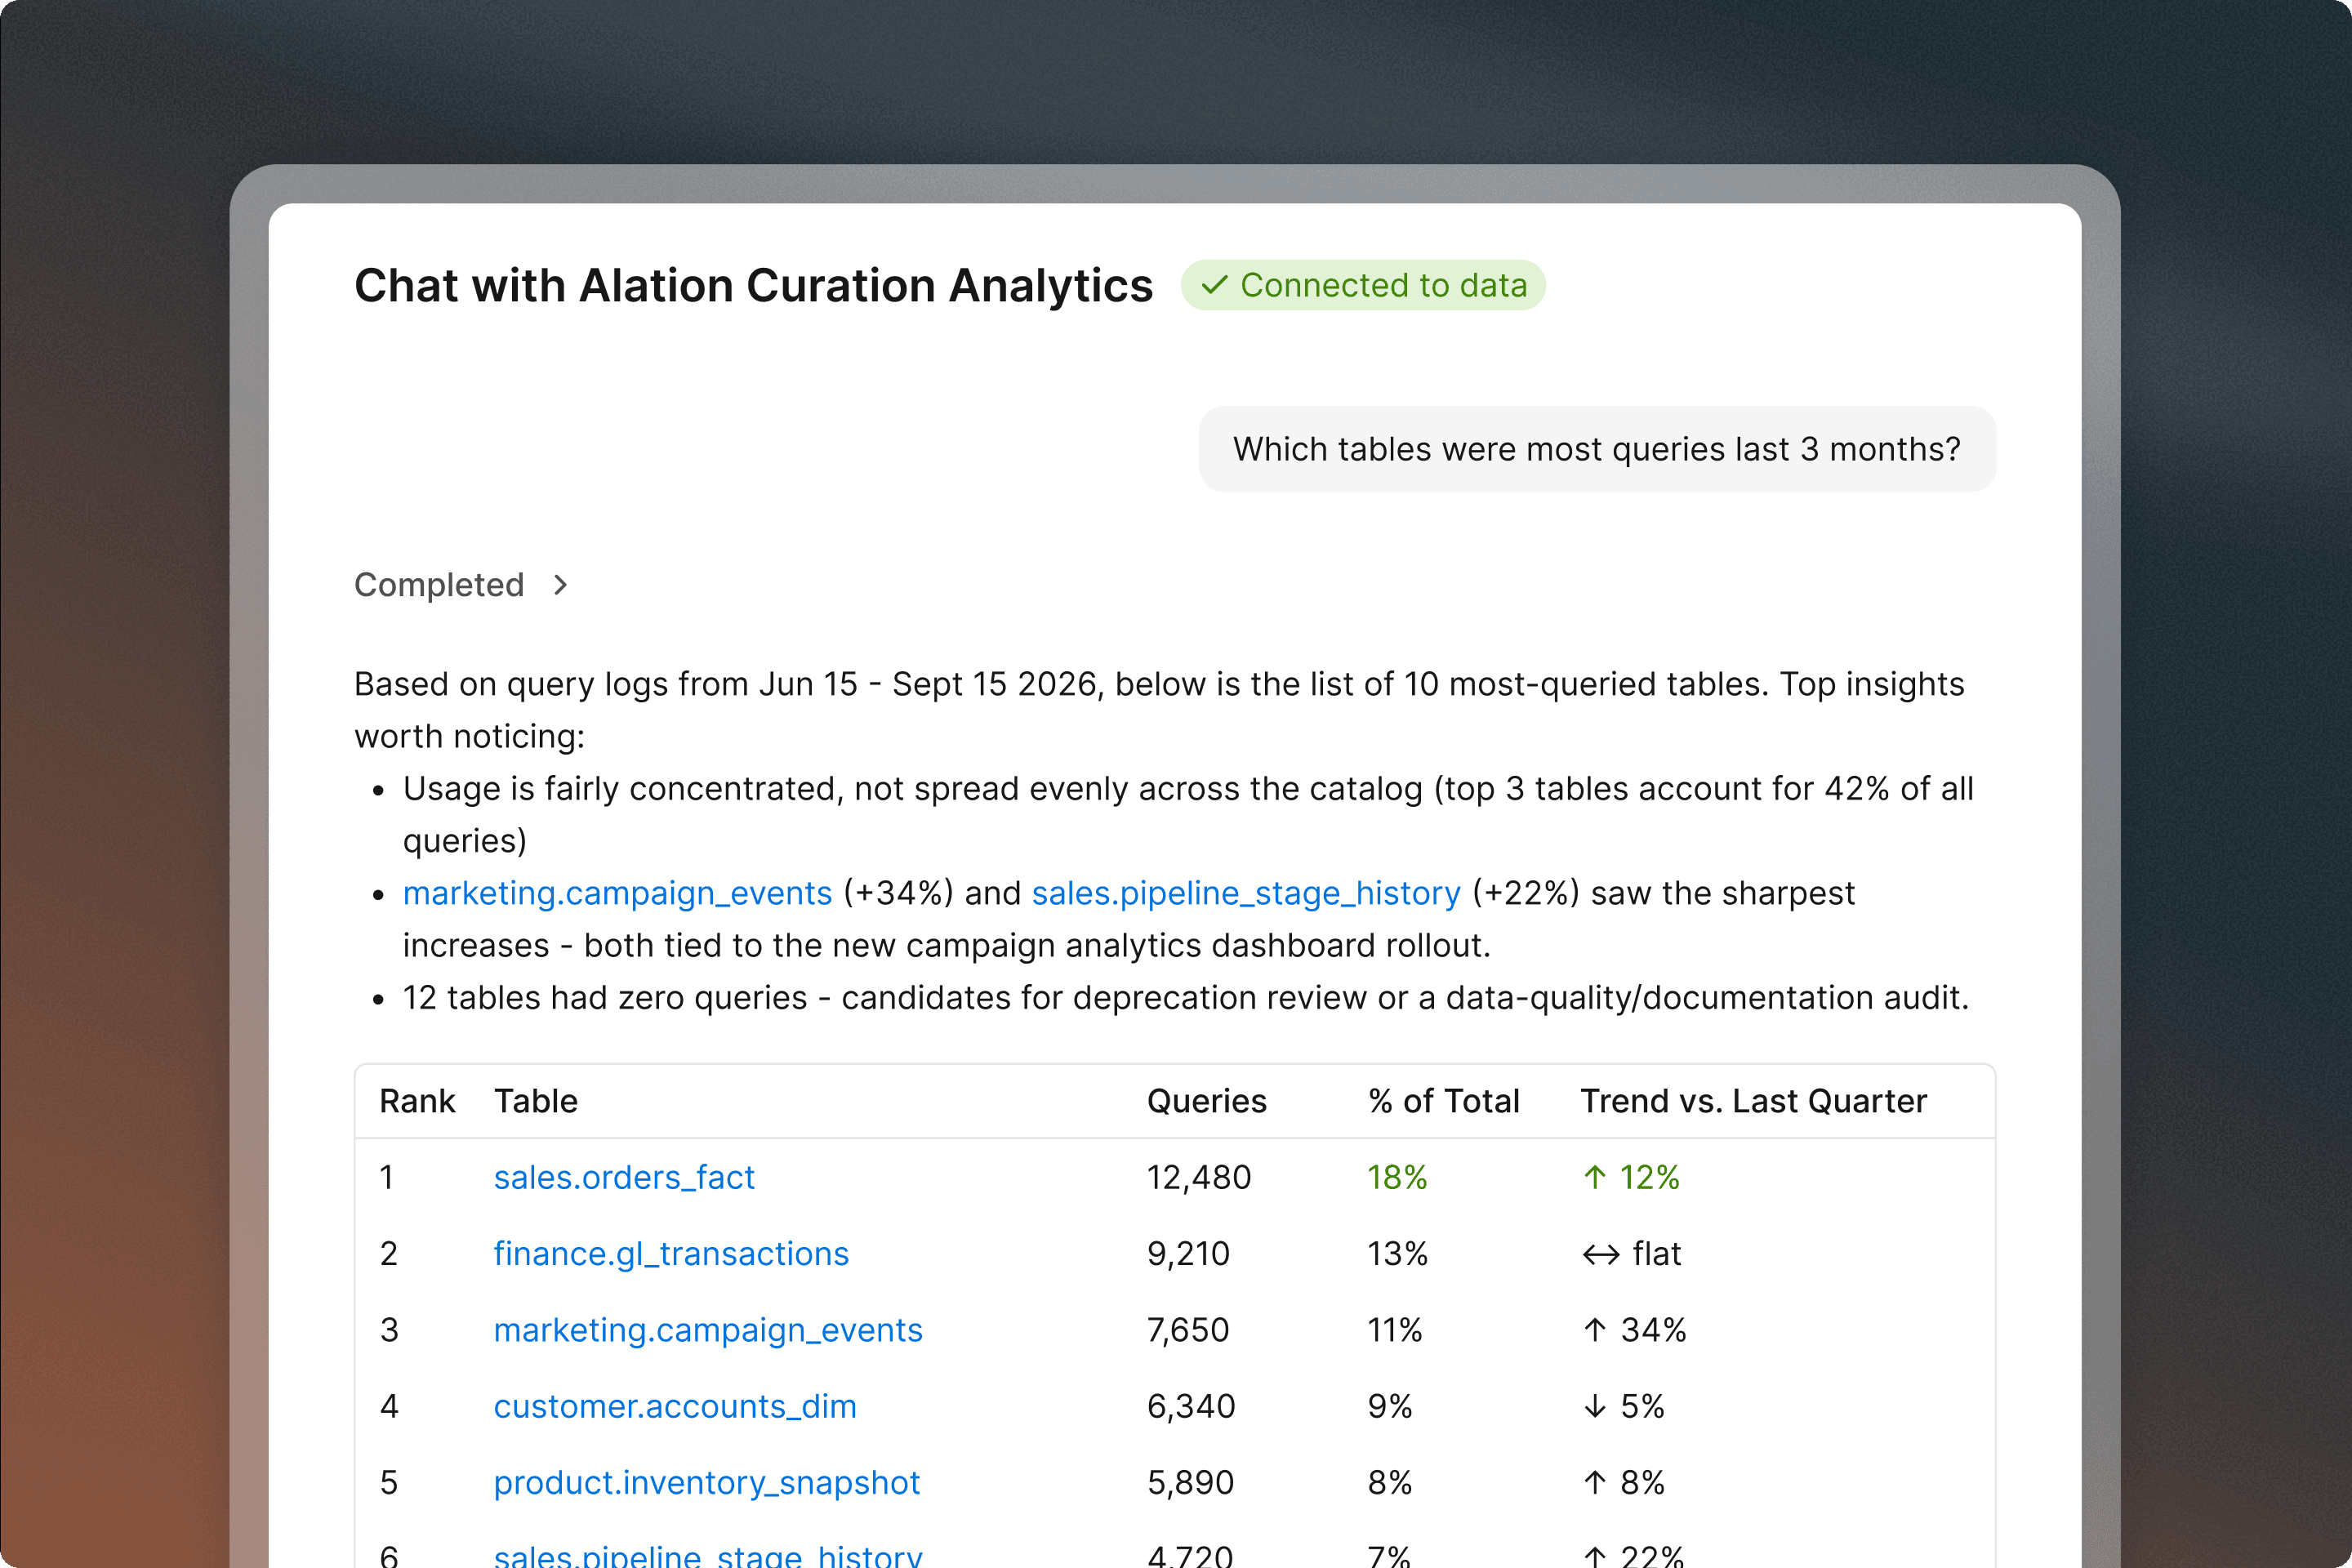
Usage signals reveal which data products, tables, and domains drive real consumption, and which drive compute cost without being touched. Make the unmanaged half of your infra spend visible. Enjoy the ease of one interface for every question about your data estate’s operations.
Analytics FAQ
What you need to know about
Alation Analytics
Q1 —
What is Alation Analytics?
Alation Analytics is built-in measurement for the data program. It tracks adoption, curation progress, governance compliance, and consumption from inside the catalog where the signals live. Most organizations measure their data program with external dashboards built on exported metrics. Alation Analytics measures what actually happens: who uses the catalog, how the record is evolving, where coverage gaps remain, and whether the foundation is getting stronger over time.
Q2 —
How is Alation Analytics different from building dashboards on catalog exports?
External dashboards measure what gets exported. Alation Analytics measures what actually happens inside the catalog. Usage patterns, curation activity, governance compliance, and query consumption are internal signals that never reach an export. The result is the operating view of the program rather than a retrospective summary built for a quarterly review.
Q3 —
What can Alation Analytics measure?
Adoption by team and week, curation progress by domain, stewardship coverage, governance compliance, and consumption patterns. It also surfaces where value concentrates (which data products and tables drive the most usage) and where spend clusters (which tables drive compute costs, which are never touched). All signals are queryable in plain language through a single interface.
Q4 —
Can Alation Analytics prove the data program is working?
Yes. Track whether curation, quality, and adoption are improving over time rather than relying on anecdotes or manually assembled slide decks. When the board asks whether the data foundation investment is delivering, the evidence is already in the system. The same signals help identify under-adopting teams, highlight stewardship gaps, and measure how quickly the foundation is being built.
Start a Conversation
Speak with an Alation Expert
A 30-minute call to discuss your priorities, challenges, and goals.
Then we’ll show you how the Alation Intelligence Operating System ensures apps and agents act on current, quality, and compliant data.
Enterprises absolutely have to trust the data underneath their most critical process and decisions. We will help you get it right.