SOLUTION · PIPELINES & OBSERVABILITY
Stop Monitoring. Start Solving.
Get alerts that show you exactly what’s broken, why it matters,
and how to fix it.
Most tools can tell you a job failed. They can't tell you who owns the table, what it feeds, or whether anyone downstream depends on it, so the investigation takes longer than the fix. Alation builds quality monitoring on the catalog you already have, so every alert arrives with the owner, the lineage, and the blast radius attached, and the signal writes back to the pipeline instead of into a dashboard nobody opens.
WHAT ALATION CAN DO FOR YOU
Something breaks.
You already know what it touches.
Quality checks inherit what the catalog already knows, lineage traces the blast radius in seconds, and 120+ connectors mean monitoring never stops at a platform boundary.
One system. Every signal enriched before it reaches you.
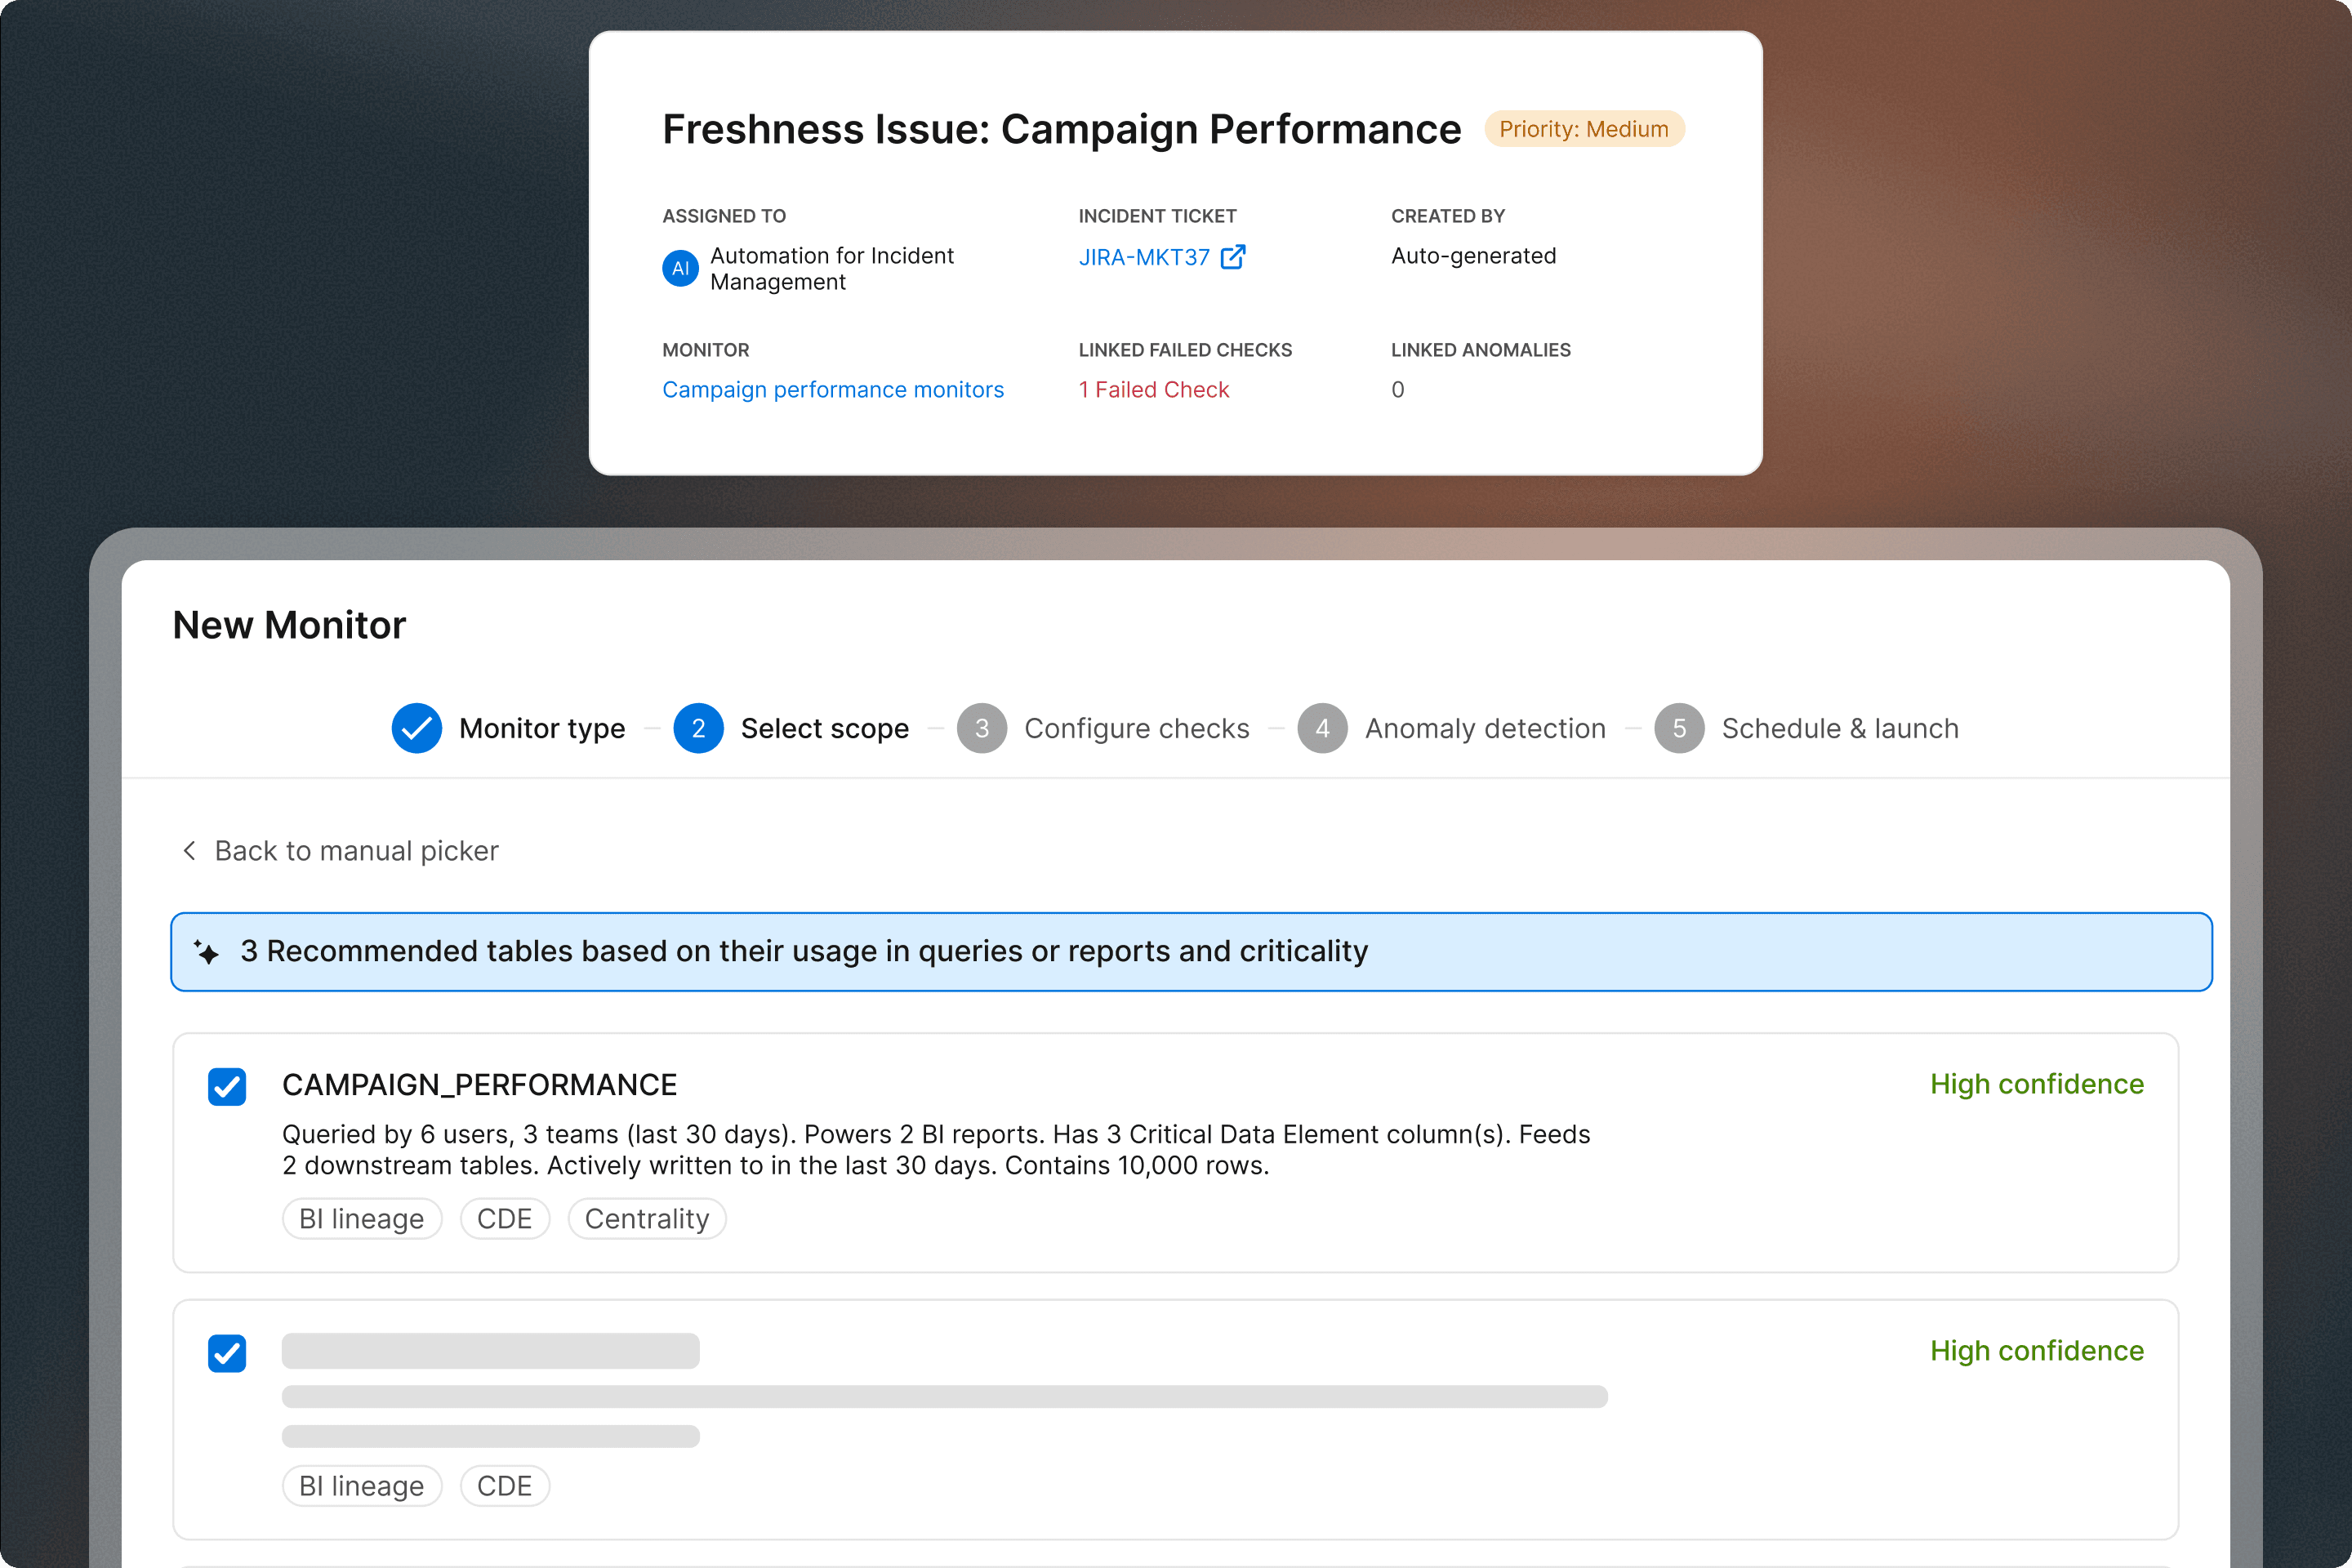
- QUALITY MONITORING
- BUSINESS IMPACT PRIORITIZATION
- DATA QUALITY
01
Find the problem.
Fix it at the source.Alation reads the metadata, usage history, and governance signals your teams have already produced, then proposes the quality checks worth running, so you aren't writing rules from scratch on day one. Usage data tells it which tables actually drive decisions, so the monitoring lands on the twenty that matter instead of the two thousand that exist. When a check fails, the alert goes to the person who owns the table, carrying its classification, its downstream consumers, and remediation plan. Then it writes back to the pipeline that produced the problem, not just to a dashboard.
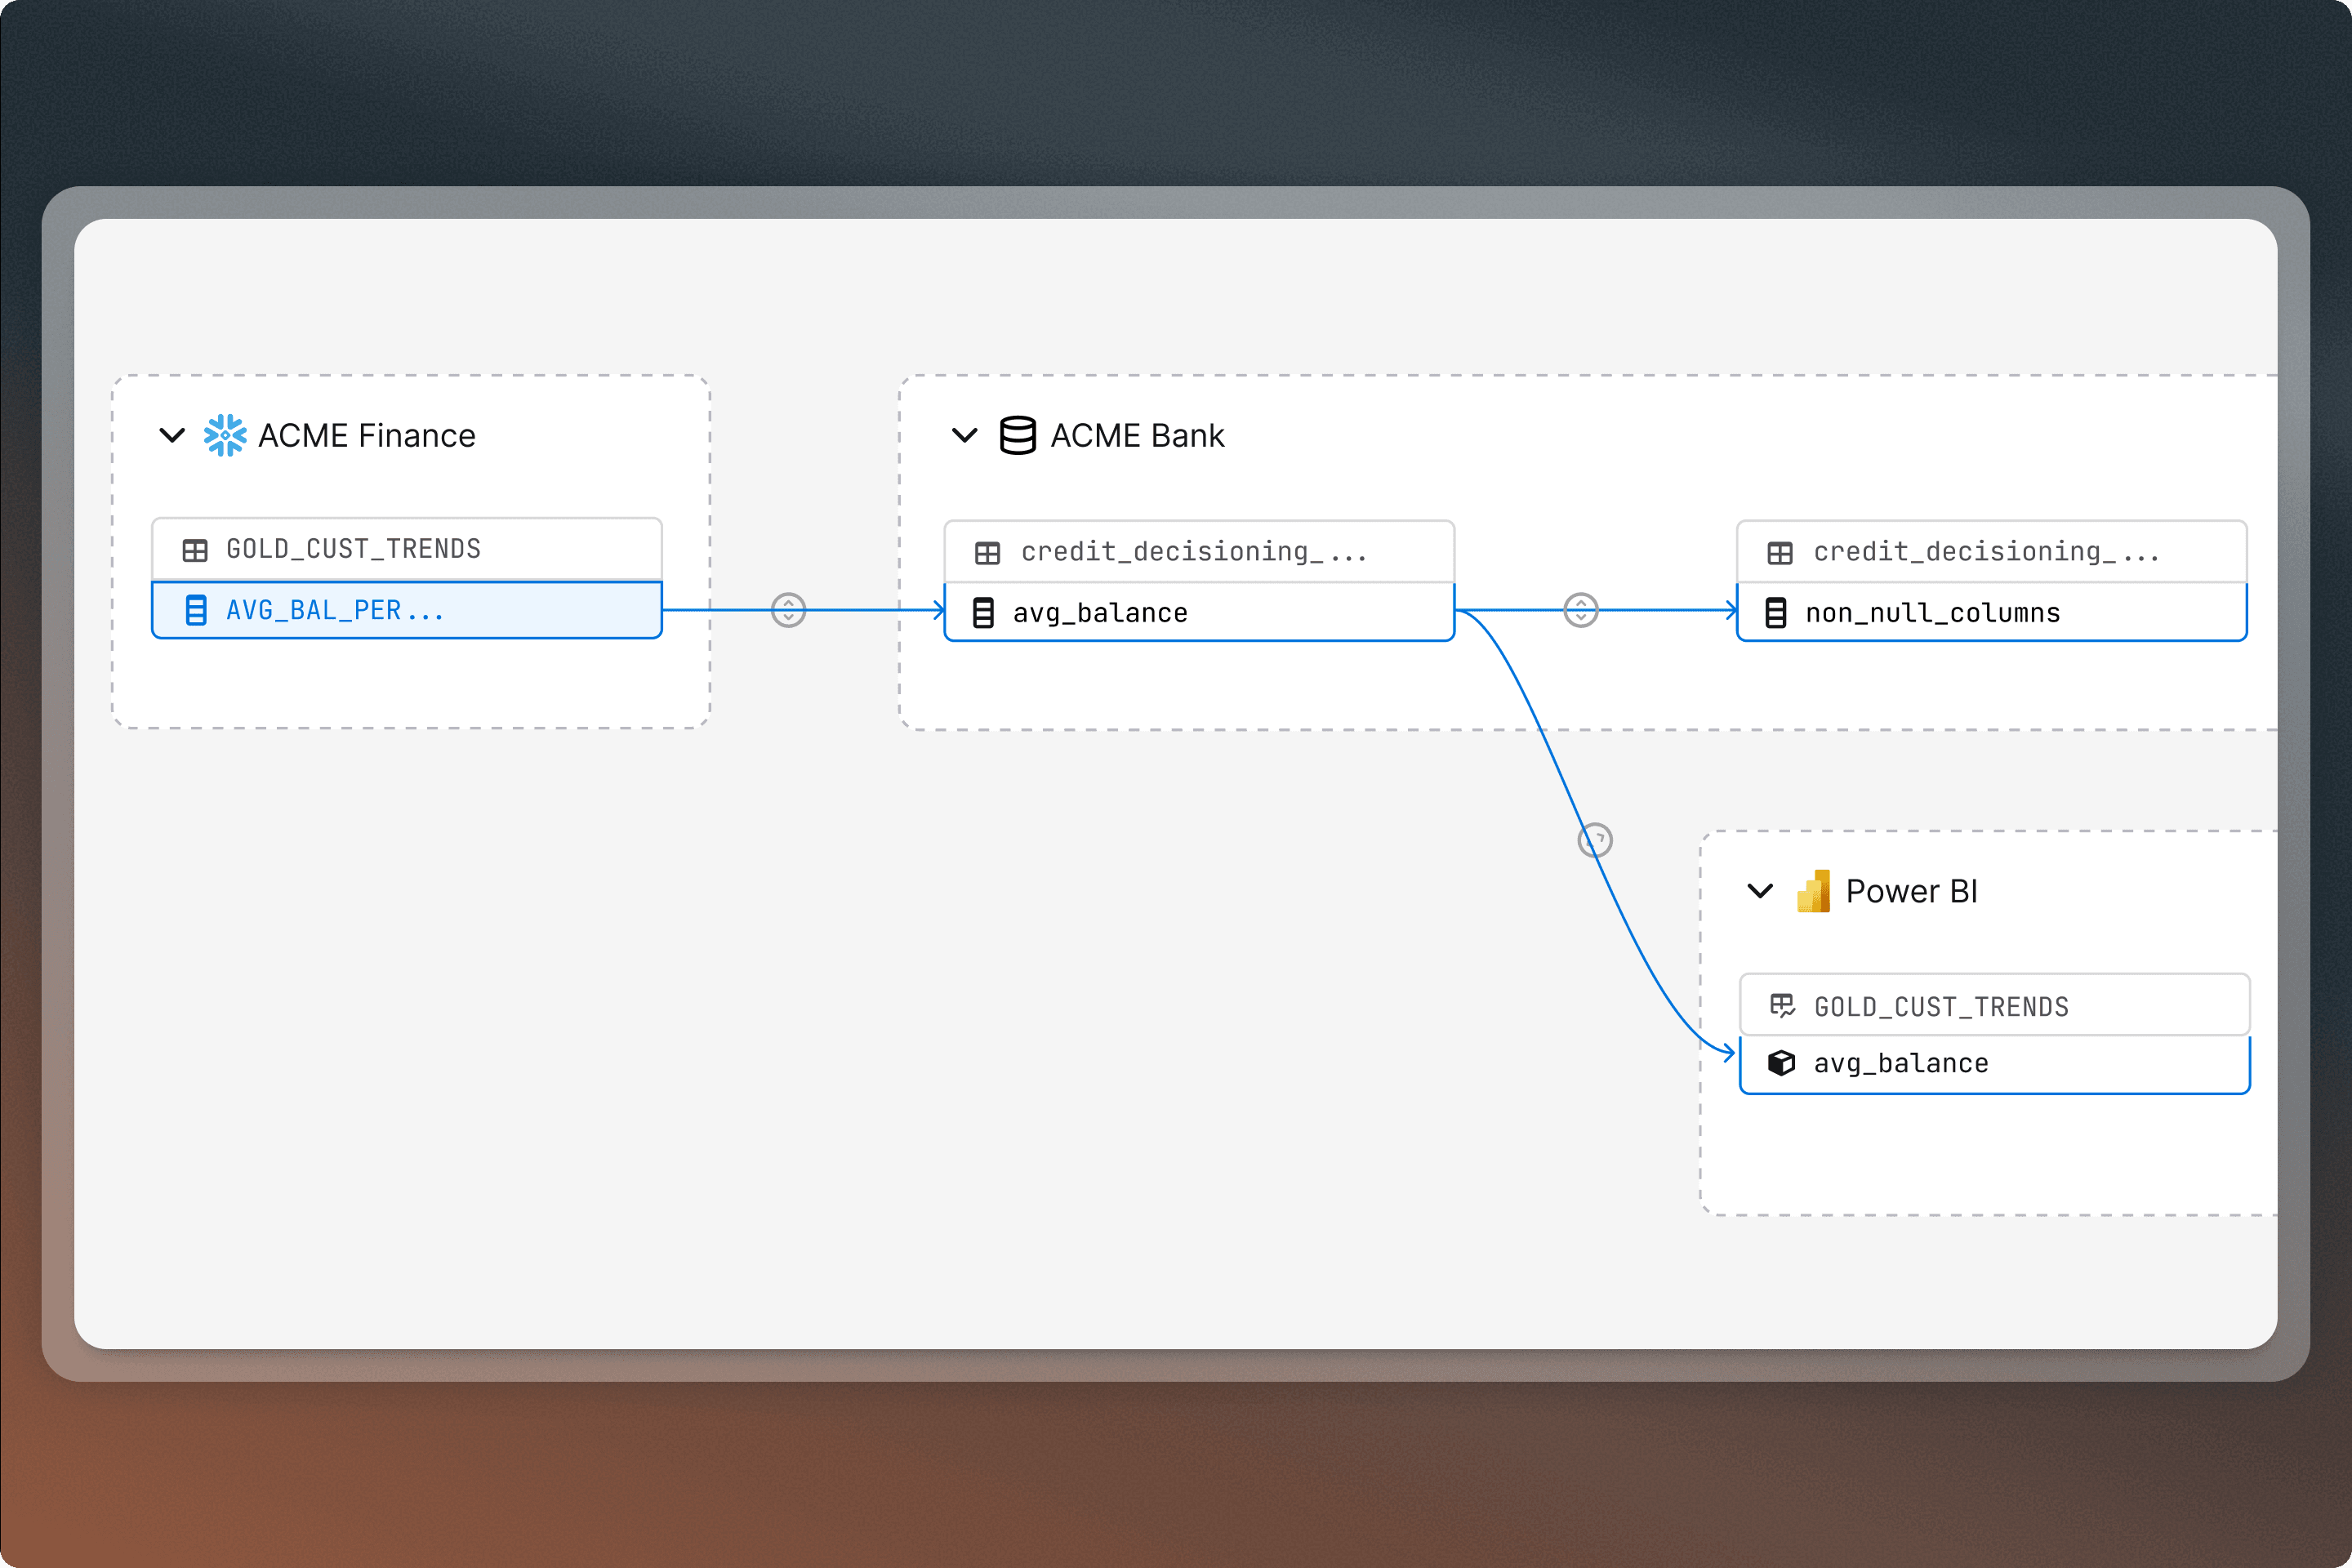
- IMPACT ANALYSIS
- ROOT CAUSE TRACING
- LINEAGE
02
Trace the blast radius.
Find the root cause.See every downstream consumer of any given asset in seconds, including dashboards, data products, agents, and regulatory filings. Trace backward through every join, transformation, and handoff with every node showing ownership, trust signals, and quality scores. Because every node carries ownership, trust signals, and its last quality result, the graph gives you the answer instead of somewhere else to look.
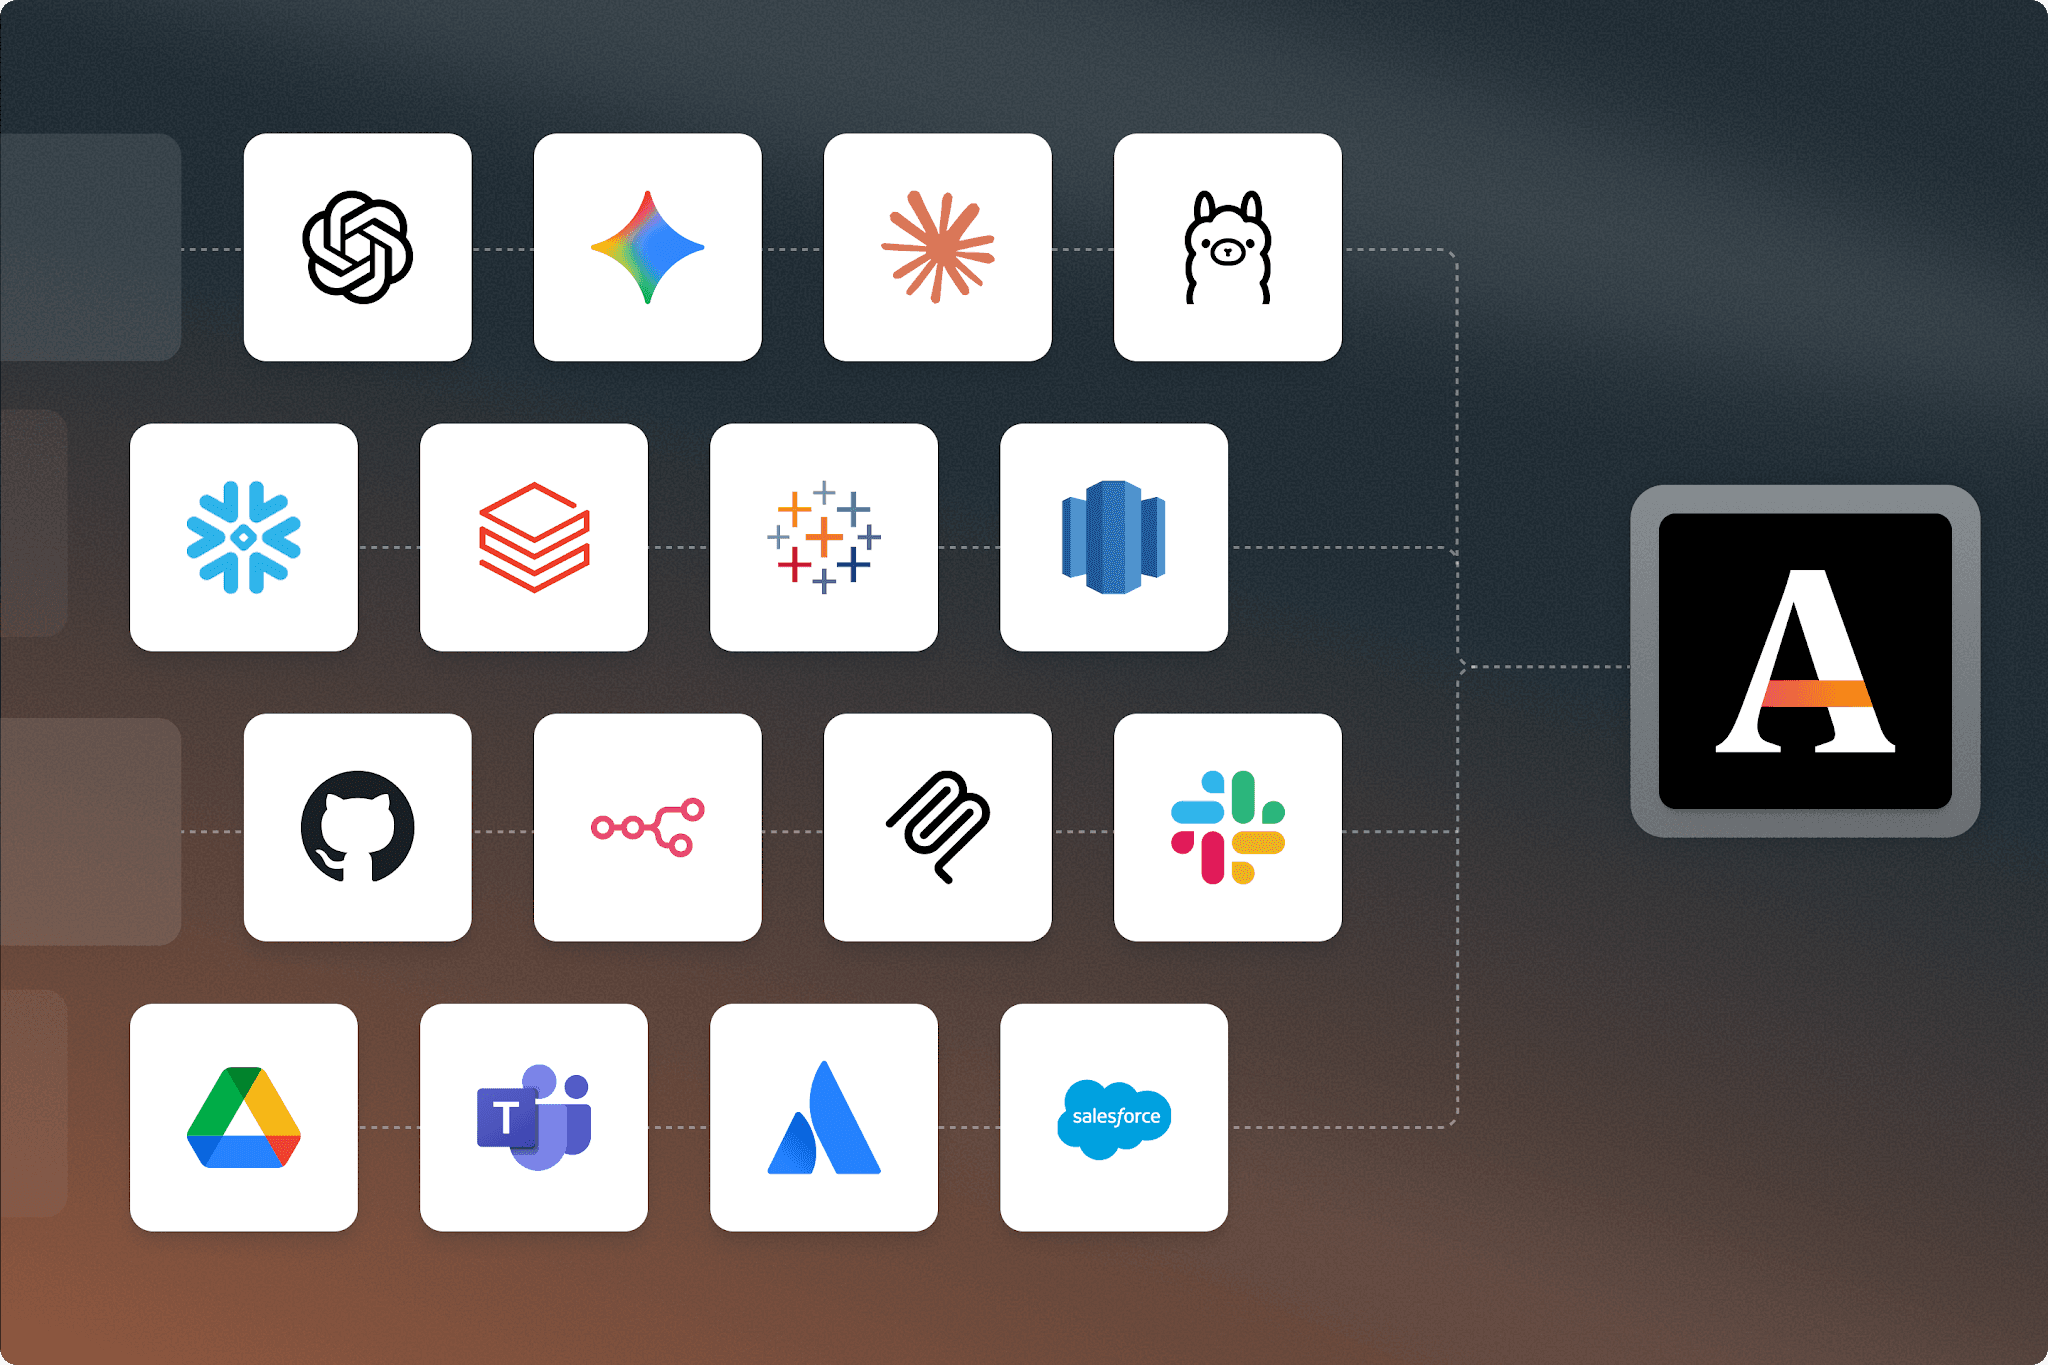
- CROSS-PLATFORM CONNECTIVITY
- CONNECTORS & SDKS
03
Monitoring that spans
your stack.With 120+ connectors, quality and lineage span every platform: Snowflake, Databricks, SAP, Oracle, and everything between them. Monitoring costs a fraction of standalone tools because checks inherit catalog metadata you have already built. Open standards and published SDKs keep your knowledge independent of any one platform, so it survives your next infrastructure decision.
Where This Gets You
When the answers have to be right, we make sure they are.
Quality flags the anomaly. Lineage traces the impact. Connectors span the estate. One shared platform enriches every signal with context.
Every alert already communicates what broke, who owns it, and what is impacted downstream. This is the difference between monitoring your data and understanding it.
What is data pipeline observability?
Data pipeline observability is the ability to detect, investigate, and resolve data quality issues across every system your data flows through. Most observability tools can tell you something failed. Alation goes further: quality checks inherit what the catalog already knows, lineage traces the blast radius in seconds, and 120+ connectors mean monitoring spans every platform in the stack. The result is alerts that carry enough context to fix the problem at the source, not just flag it.
How does Alation detect data quality issues in pipelines?
Alation AI recommends quality checks from existing metadata, usage patterns, and governance signals. There is no cold start: the catalog already holds the context that standalone monitoring tools would have to build from scratch. Not every anomaly is equal, so usage analysis surfaces which data drives real decisions and monitoring effort goes where it matters most. When an issue is detected, it routes to the right owner with classification, lineage, and remediation context attached.
How does data lineage help investigate pipeline failures?
When something breaks, lineage shows every downstream consumer of the affected asset in seconds: dashboards, data products, agents, and regulatory filings. Tracing backward through every join, transformation, and handoff identifies the root cause. Investigation time drops from days to minutes. Every node in the lineage graph carries ownership, trust signals, and quality scores, so the person investigating gets an answer, not just a path to follow.
How does Alation monitor data across multiple platforms?
Alation connects to 120+ sources across Snowflake, Databricks, SAP, Oracle, and everything between them. Quality and lineage span every platform through one governance layer. Monitoring costs a fraction of standalone tools because checks inherit catalog metadata that already exists. Open standards and SDKs ensure the connectivity layer stays independent of any single platform, so monitoring survives your next infrastructure decision.
How is Alation different from standalone data observability tools?
Standalone observability tools detect anomalies but stop at detection. They lack the catalog context to prioritize by business impact, the lineage to trace the blast radius, and the cross-platform connectivity to monitor beyond one environment. Alation unifies quality, lineage, and connectivity in one system so that every alert carries what broke, who owns it, and what is downstream. The feedback loop closes: signals write back to the pipeline, not just to a dashboard that nobody opens.
Start a Conversation
Speak with an Alation Expert
A 30-minute call to discuss your priorities, challenges, and goals.
Then we’ll show you how the Alation Intelligence Operating System ensures apps and agents act on current, quality, and compliant data.
Enterprises absolutely have to trust the data underneath their most critical process and decisions. We will help you get it right.