Understanding Alation Data Quality Architecture
Alation Cloud Service Applies to Alation Cloud Service instances of Alation
Alation Data Quality leverages a distributed microservices architecture designed specifically for Alation Cloud Service environments. The system integrates with the Alation Data Catalog and employs various specialized services to enable comprehensive data quality checking and reporting.
Alation Data Quality Monitoring Concepts
Understanding these fundamental concepts is essential for effective use of Alation Data Quality:
Check: A validation rule applied to specific data metrics, returning pass, fail, or error status based on defined thresholds. Examples include accuracy checks (validating numeric ranges), completeness checks (ensuring no missing values), or validity checks (format validation).
Monitor: A container grouping one or more checks tied to tables and their attributes, executing on a defined schedule.
Asset: A table and its columns from a data source or BI report actively monitored for quality metrics.
System Components and Architecture
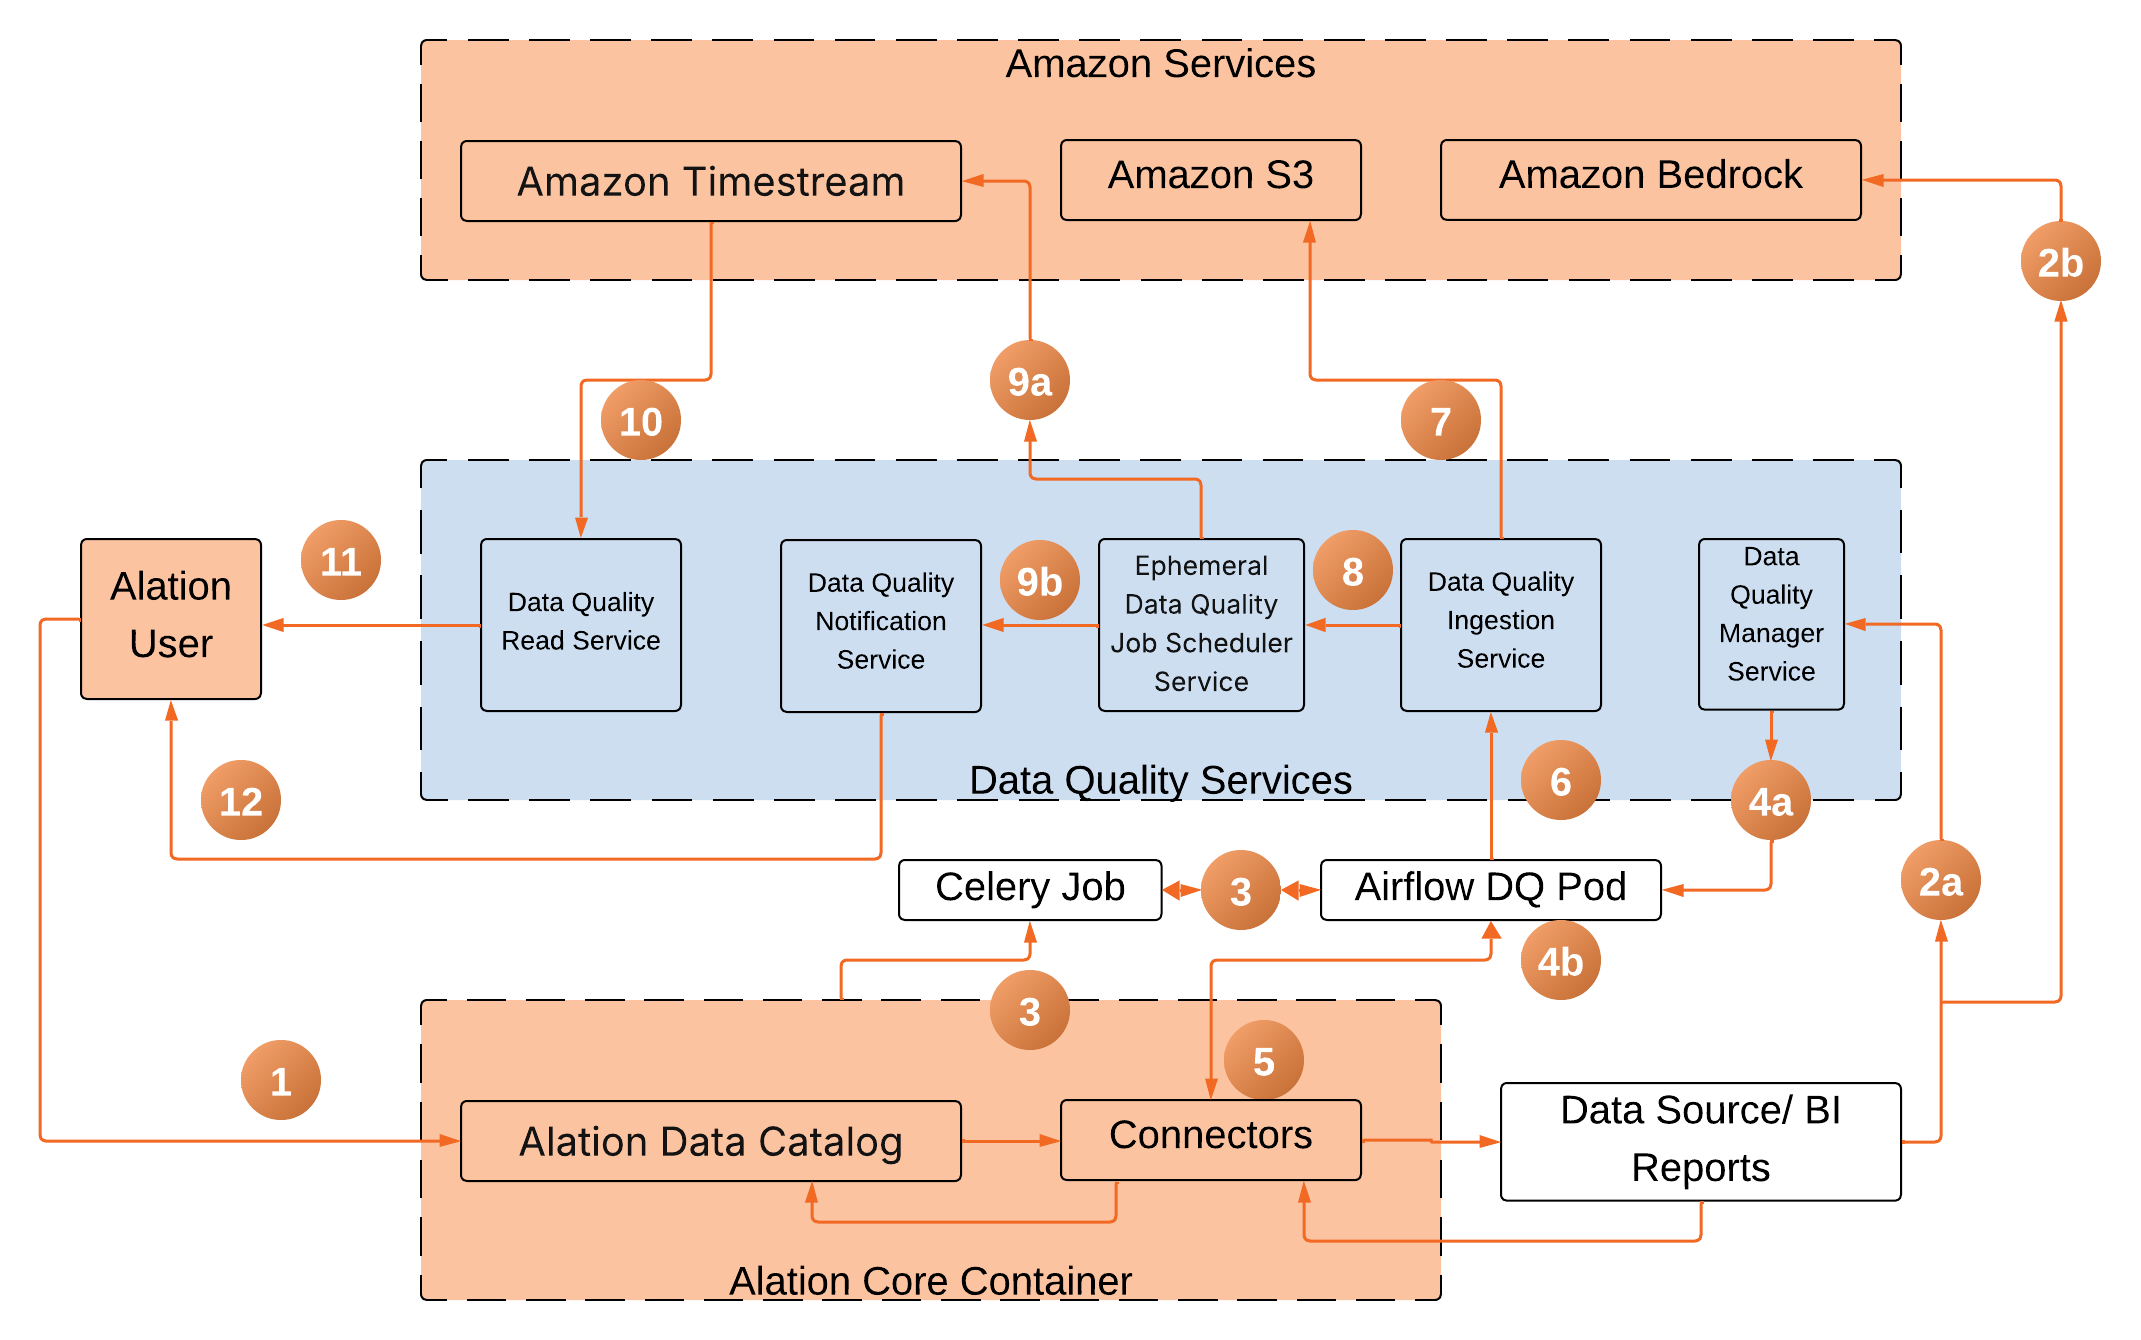
The Alation Data Quality architecture is composed of several key components designed to ensure robust data governance and user experience. It integrates the Alation Core Container for cataloging and user interactions, the Data Quality Manager Service for configuring monitoring, and the Airflow DQ Pod for executing data quality checks. AI-powered recommendations are provided by Amazon Bedrock, while the Data Quality Ingestion Service handles the processing and storage of check results. Amazon Timestream stores historical metrics, and the Data Quality Notification Service manages all alerts.
The architecture consists of the following key components:
Alation Core Container: Houses the Data Catalog and coordinates user interactions.
Data Quality Manager Service: Stores and manages monitor configurations.
Airflow DQ Pod: Executes data quality checks using pushdown SQL queries.
Amazon Bedrock: Provides AI-powered check recommendations via Claude 3 Sonnet.
Data Quality Ingestion Service: Processes and stores check results.
Amazon Timestream: Time-series database for historical quality metrics.
Data Quality Read Service: Fetches the results from the Amazon Timestream and displays them in the user interface.
Data Quality Notification Service: Manages alerts and notifications.
Data Quality Incident Service: Manages the creation and linking of incidents to external ITSM systems like Jira.
Architecture
Monitor Creation: Includes manual checks, optional AI-Check Recommendation (using Bedrock), and optional data profiling.
Scheduled Monitor Execution (Service Account): The core “Airflow DQ Pod” flow that runs checks using the service account and can automatically trigger notifications and incidents.
Interactive Data Analysis (Individual User Credentials): Includes on-demand flows (failed records and root cause analysis) that occur after execution and use the individual user’s credentials.
Monitor Creation
        %%{init: {
  'theme': 'base',
  'themeVariables': {
    'fontFamily': 'Public Sans, Open Sans, sans-serif',
    'actorBkg': '#ffffff',
    'actorBorder': '#002E4B',
    'actorTextColor': '#002E4B',
    'signalColor': '#E36624',
    'signalTextColor': '#35444D',
    'noteBkgColor': '#FFF6E5',
    'noteBorderColor': '#FDA600'
  },
  'sequence': {
    'actorWidth': 300,
    'messageMargin': 40
  }
}}%%
sequenceDiagram
    title Monitor Creation Flow

    box rgb(255, 246, 229) [Alation SaaS]
        participant U as "User"
        participant ADC as "Alation Data<br/>Catalog"
        participant DPS as "Database<br/>Profiling<br/>Service"
        participant DQS as "Data Quality<br/>Service"
    end

    box rgb(244, 245, 247) [Customer Data Source]
        participant DS as "Data Source"
    end

    box rgb(254, 242, 233) [AWS Services]
        participant AB1 as "Amazon<br/>Bedrock"
        participant AB2 as "Amazon<br/>Bedrock"
        participant RDS as "AWS RDS"
        participant AMS as "AWS Managed<br/>Services"
    end

    U->>ADC: 1 Search & Select Table / Asset
    ADC->>DS: 1 Create Data Quality Checks

    ADC-->>DPS: 2 (Optional) Profile Data
    DPS-->>ADC: Return Profile Metadata

    ADC->>DQS: 3 Store Monitor Definition
    DPS->>DQS: 3 Send Profile Results

    ADC->>AB1: 4 Request AI Recommendations
    AB1-->>AB2: Process via Claude 3
    AB2-->>ADC: 4 LLM Recommendations

    DPS->>AB2: 5 Call Bedrock LLM (Sensitive Data)

    AB2-->>RDS: 6 Store Model Metadata
    DQS->>RDS: 7 Sync Monitor Metadata

    RDS-->>AMS: 11 Trigger AWS Managed Services
The user begins by interacting with the Alation Data Catalog (Alation Core Container), which contains the metadata of the cataloged data assets, to create a monitor (manual or SDK) on the Data Quality interface. Alation Data Catalog stores the metadata using the metadata extraction (MDE), lineage for the BI reports, and query log ingestion (QLI) from the data source connectors.
Alation Core Container interacts with the Data Quality Manager Service:
For manual checks, Alation Core Container sends and stores the monitor information to the Data Quality Manager database.
For AI-driven checks (Recommend Checks), the Alation Core Container sends the column name and column type to the Amazon Bedrock service, fetches the recommended checks and then stores the monitor information to the Data Quality Manager Database.
(Optional) During check configuration, user can optionally run data profiling on tables and columns.
Columns marked as sensitive or PII are flagged in profiling results.
Note
Alation Data Quality data profiling respects organization’s data governance policies and so sensitive data handling follows established classification rules.
(Optional) After check configuration, user can optionally add the anomaly metric type on target tables to detect anomalies and do analysis after the monitor run.
Scheduled Monitor Execution (Service Account)
        %%{init: {
  'theme': 'base',
  'themeVariables': {
    'fontFamily': 'Public Sans, Open Sans, sans-serif',
    'actorBkg': '#ffffff',
    'actorBorder': '#002E4B',
    'actorTextColor': '#002E4B',
    'signalColor': '#E36624',
    'signalTextColor': '#35444D',
    'noteBkgColor': '#FFF6E5',
    'noteBorderColor': '#FDA600'
  },
  'sequence': {
    'actorWidth': 300,
    'messageMargin': 40
  }
}}%%
sequenceDiagram
    box rgb(255, 246, 229) [Alation SaaS]
        participant SCH as "Alation Core<br/>(Scheduler)"
        participant ADQ as "Airflow DQ Pod"
        participant QS as "Query / Read<br/>Service"
        participant DQIS as "Data Quality<br/>Ingestion Service"
        participant OS as "Orchestrator Service"
        participant NS as "Notification Service"
    end

    box rgb(244, 245, 247) [Customer Data Source]
        participant CDB as "Customer Database"
    end

    box rgb(254, 242, 233) [AWS Managed Services]
        participant S3 as "Amazon S3"
        participant CJP as "Converter Job Pod"
        participant TS as "Amazon Timestream"
        participant ITSM as "ITSM System<br/>(Jira)"
    end

    Note over SCH, QS: Phase 1: Evaluate Checks
    SCH->>ADQ: 3. Create Celery Job & Call Pod
    ADQ->>ADQ: 4. Fetch Monitor Defs & Credentials

    ADQ->>QS: 5. Pass Pushdown SQL Query
    QS->>CDB: 5. Execute Checks (Service Account)
    CDB-->>QS: 6. Return Aggregated Results
    QS-->>ADQ: 6. Fetch Monitor Run Results

    Note over DQIS, OS: Phase 2: Persist Results
    ADQ->>DQIS: 6. Send Results for Ingestion
    DQIS->>S3: 7. Store Results in S3
    DQIS->>OS: 8. Call Orchestrator Service

    Note over S3, ITSM: Phase 3: Notify
    OS->>CJP: 9a. Launch Converter Job Pod
    CJP->>TS: 9a. Store Historical Metrics
    OS->>NS: 9b. Send Data for Alerts
    NS->>ITSM: 10. Auto-Create Incident Ticket
When a user runs a monitor, the Alation Core Container creates a Celery job and calls the Airflow DQ Pod.
The Airflow DQ Pod fetches
The monitor definition from the Data Quality Manager.
The credentials from the data source connectors in the Alation Core Container.
The Airflow DQ Pod then creates a pushdown SQL query based on the check rules as defined by the user or recommended by AWS Bedrock and passes it to the Query Service of the data source connectors for execution. The Query Service executes the data quality checks against the target data source. It authenticates using the default service account configured for that data source. For a monitor to run successfully, this service account must have been granted
SELECTprivileges on all tables being monitored.The Airflow DQ Pod then fetches the results of the monitor run and sends them to the Data Quality Ingestion service
The Data Quality Ingestion Service stores the results in Amazon S3.
The Data Quality Ingestion Service calls the Orchestrator Service.
The Orchestrator Service:
Launches a Convertor Job Pod on demand to process and store these results based on the timestamp in the Amazon Timestream database.
Send the data to the Data Quality Notification Service.
The Data Quality Incident Service creates a new ticket in the connected ITSM system (Jira) and notifies plugins of anomalies and checks if the auto-create incident setting is enabled.
Data Quality Presentation
Amazon Timestream then sends the results to the Data Quality Read Service.
The Data Quality Read Service sends the results to the user.
The Data Quality Notification Service sends the notifications and alerts to the user.
Interactive Data Analysis (Individual User Credential Based)
This flow occurs after a monitor has run and is initiated by a user reviewing the results. This model enforces user-level permissions, ensuring the user can only analyze data they are already authorized to see.
Note
Alation Data Quality does not store user credentials.
To diagnose the failure for checks, the user:
Link the failed check to an existing incident or create a new incident.
Performs Failed Record Analysis:
Provide their individual user account credentials to establish a direct connection to the data source.
Retrieves sample records.
Performs Root Cause Analysis:
Provide their individual user account credentials to establish a direct connection to the data source.
Retrieves sample records and masked data is sent to the LLM for root cause analysis.
To diagnose the detected anomalies, the user:
Link the detected anomalies to an existing incident or create a new incident.
Provide feedback to the LLM for detected anomalies.
External Execution Architecture (SDK)
Alation Data Quality supports an Open Data Quality architecture that allows monitors to be executed outside of the Alation platform while maintaining centralized governance. You must first create an SDK-Enabled Monitor in the Alation Data Quality application to define your checks. Then, you can use the Alation Data Quality SDK on PyPI to execute those checks programmatically in your external environment.
When using SDK-Enabled monitors:
Pushdown Execution: Queries run directly in your data warehouse (for example, Snowflake or BigQuery), not inside Alation.
Zero Data Extraction: The SDK ensures no data is extracted or stored by Alation. Computation happens in your data platform, and only the results (pass or fail status, metadata) are published back to the Alation catalog.
Dynamic Configuration: The SDK automatically fetches data source credentials and check definitions from Alation at runtime, requiring zero manual configuration in your pipeline code.
Anomaly Model Training Pipeline
This backend pipeline securely manages the training and versioning of machine learning models used to detect data anomalies.
        %%{init: {
  'theme': 'base',
  'themeVariables': {
    'fontFamily': 'Public Sans, Open Sans, sans-serif',
    'actorBkg': '#ffffff',
    'actorBorder': '#002E4B',
    'actorTextColor': '#002E4B',
    'signalColor': '#E36624',
    'signalTextColor': '#35444D',
    'noteBkgColor': '#FFF6E5',
    'noteBorderColor': '#FDA600'
  },
  'sequence': {
    'actorWidth': 300,
    'messageMargin': 40
  }
}}%%
sequenceDiagram
    box rgb(254,242,233) AWS Managed Services
        participant CS as "Cron Schedule<br/>(Amazon EventBridge)"
        participant SF as "AWS Step Functions"
        participant TS as "Time-series Store<br/>Amazon Timestream<br/>Managed InfluxDB"
    end
    box rgb(230,234,237) AWS Storage
        participant S3T as "Amazon S3<br/>/training-data/{tenant}/<br/>{metric}/{runId}"
        participant S3M as "Amazon S3<br/>/models/{tenant}/<br/>{metric}/{version}/"
    end
    box rgb(255,246,229) Alation SaaS [Compute]
        participant TOS as "Training<br/>Orchestrator Service"
        participant ETP as "Ephemeral Training<br/>Pod (K8s Job)"
        participant NM as "Notification / Metadata<br/>(Optional)"
    end

    CS->>SF: 1 Trigger
    SF->>TS: 2 Select Time-series Store
    SF-->>TS: 3 Fetch Training Data
    TS-->>S3T: 4 Upload Dataset to S3
    SF-->>TOS: 5 Trigger Training Job
    TOS->>ETP: 6 Launch Ephemeral Pod
    ETP-->>S3T: Read Training Data from S3
    Note over ETP: Train Anomaly Model
    Note over ETP: Validate & Version Model
    ETP-->>S3M: 7 Store Model Artifacts
    ETP->>NM: 8 Emit Training Complete Event
Trigger: A cron schedule via Amazon EventBridge initiates the workflow by triggering AWS Step Functions.
Select Time-series Store: AWS Step Functions identifies and selects the appropriate time-series database (Amazon Timestream or Managed InfluxDB).
Fetch Training Data: AWS Step Functions commands the time-series store to retrieve the historical data required for model training.
Upload Dataset to S3: The time-series store securely uploads the fetched training data to an Amazon S3 bucket within the AWS Storage layer.
Trigger Training Job: AWS Step Functions signals the Training Orchestrator Service located in the Alation SaaS Compute environment to begin the training process.
Launch Ephemeral Pod: The Training Orchestrator Service provisions an Ephemeral Training Pod (a temporary Kubernetes Job) dedicated to this specific training run.
Process and Store Artifacts:
The Ephemeral Pod reads the training data from the Amazon S3 bucket.
The pod trains the anomaly model, validates it, and assigns a version.
The pod stores the finalized model artifacts back into an Amazon S3 models bucket.
Emit Training Complete Event: Once the model artifacts are securely stored, the Ephemeral Training Pod emits an optional completion event to the Notification/Metadata service.