Access the Data Quality Features
Alation Cloud Service Applies to Alation Cloud Service instances of Alation
Alation Data Quality surfaces data-quality information in the catalog and applies the catalog’s existing permissions model. Visibility aligns with catalog access: you can view quality details only for the cataloged assets you are allowed to access.
You can access data quality information in multiple ways:
Primary Application
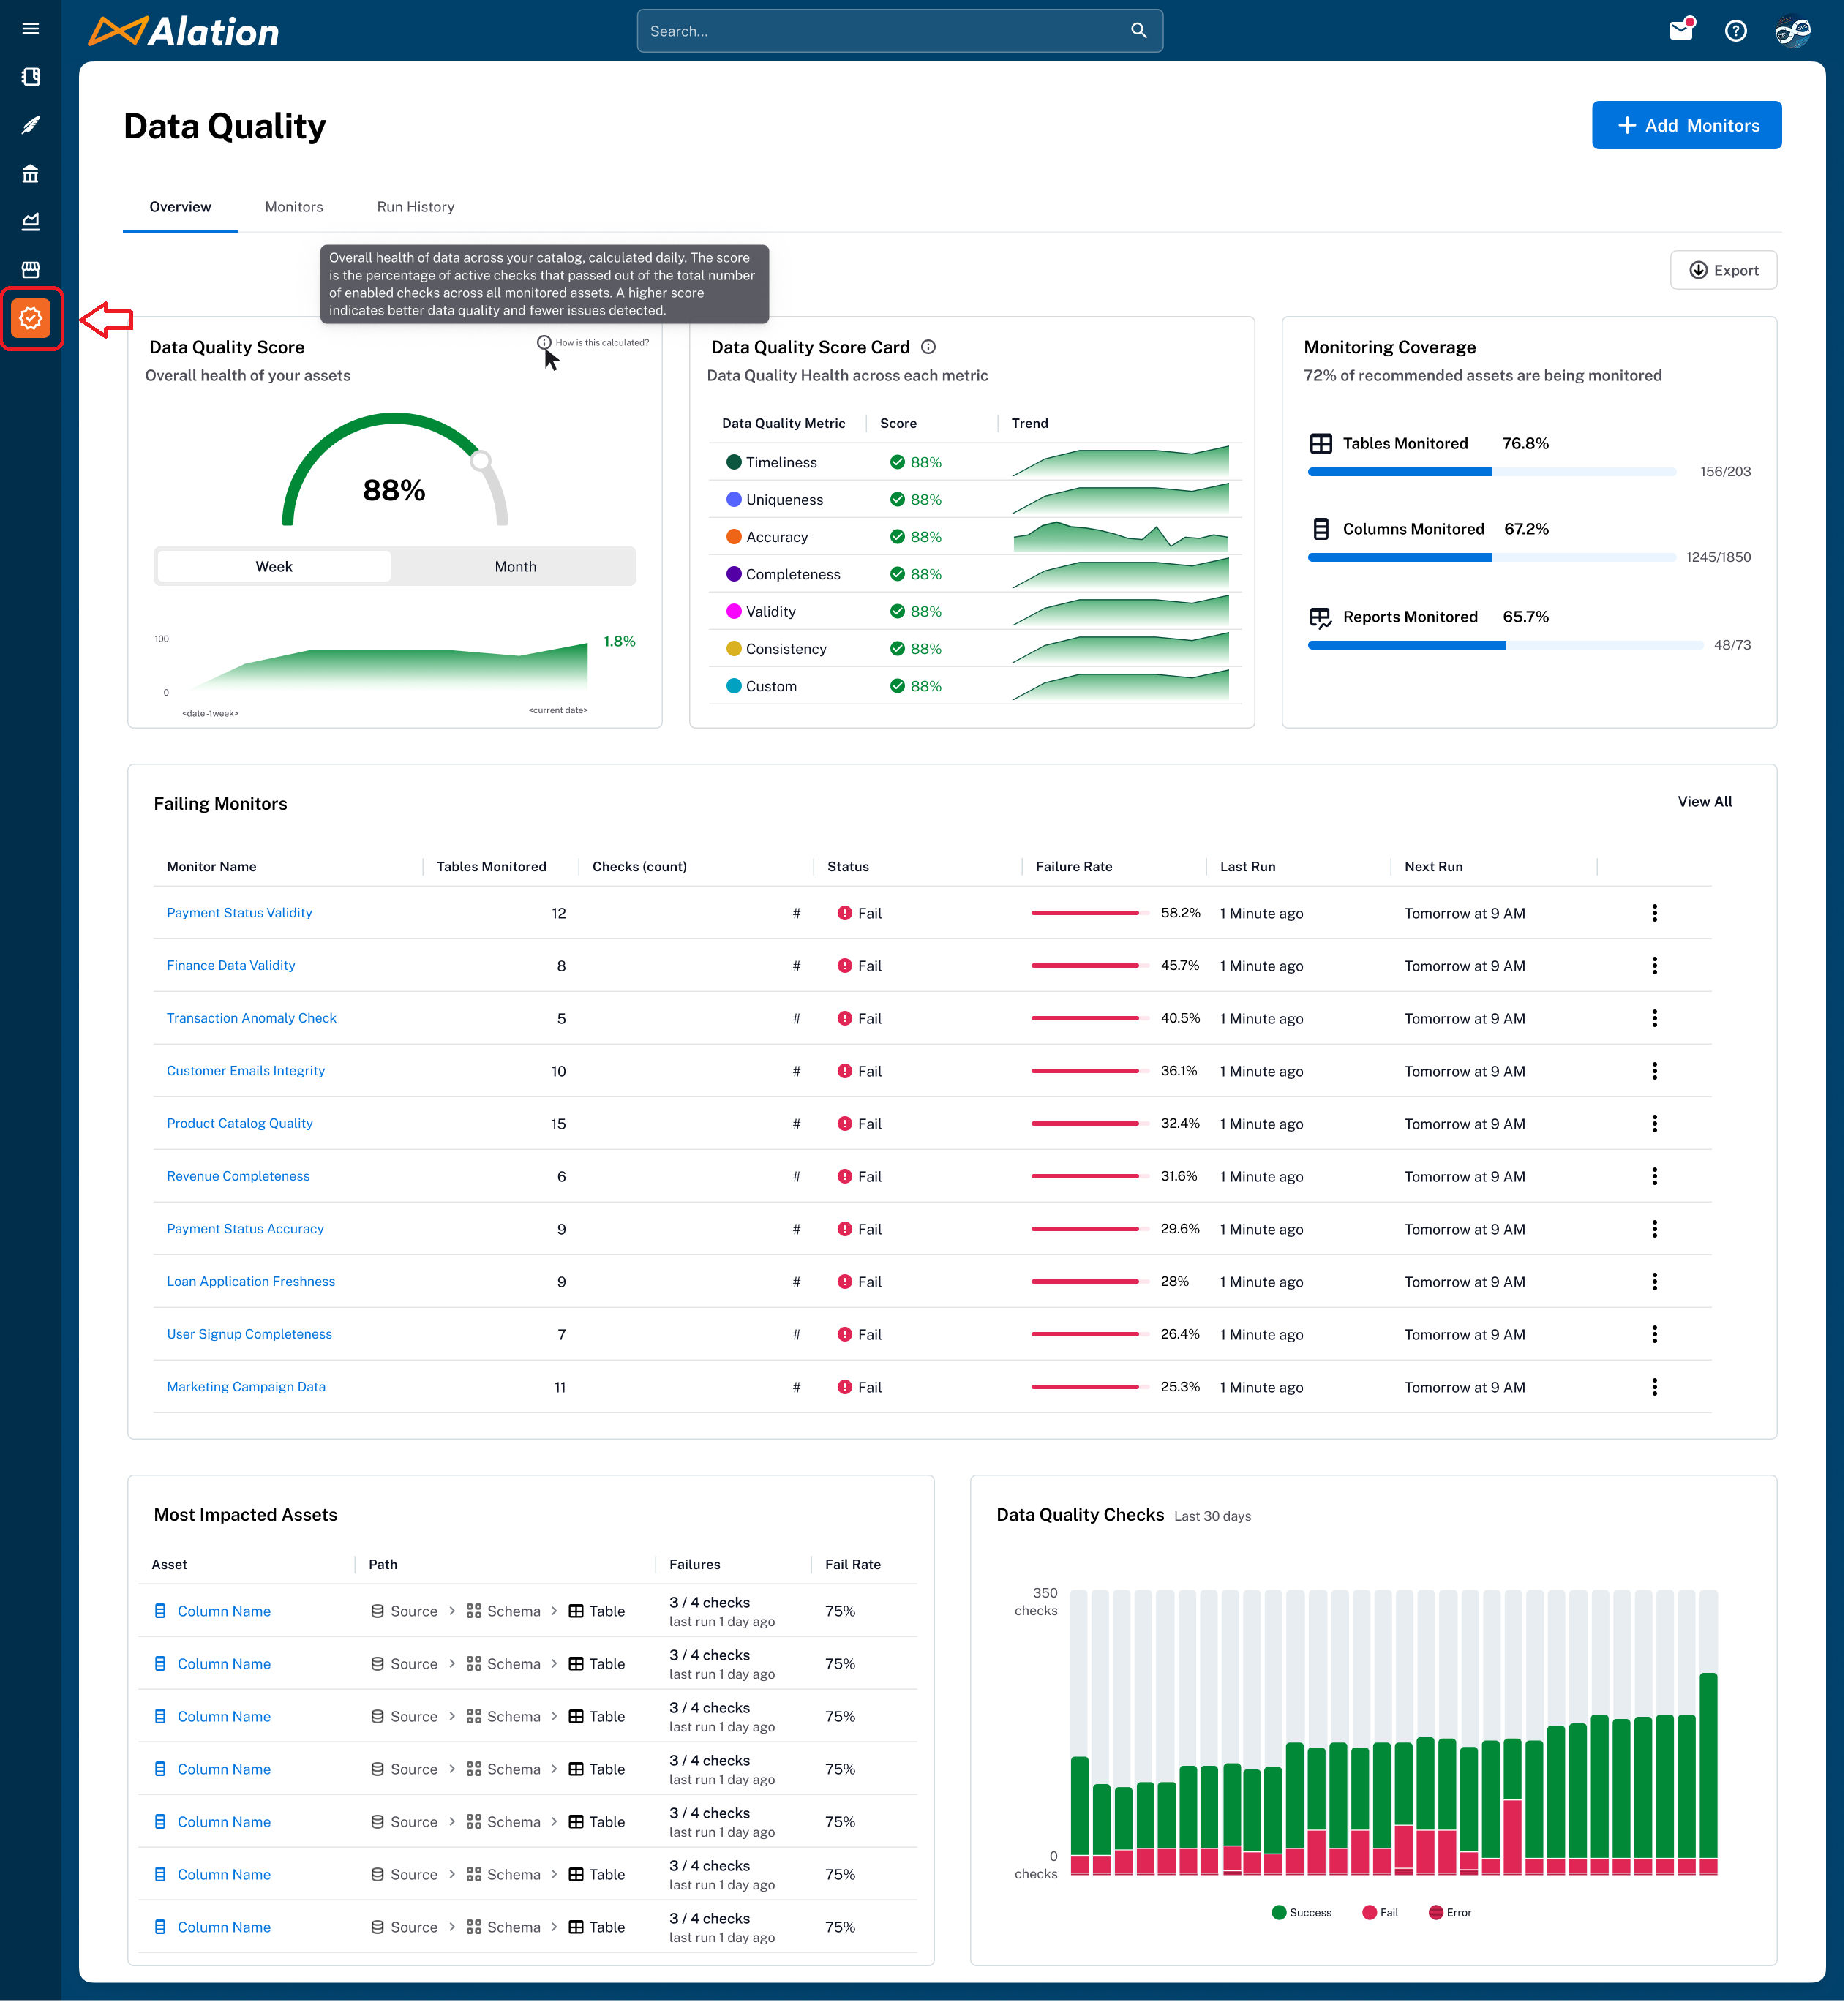
Navigate to Data Quality from the left navigation panel in the Alation application.
View the full Data Quality dashboard with comprehensive monitoring and configuration capabilities.
The screenshot below shows how to locate the Data Quality App on the left-side navigation bar. Clicking this icon opens the Data Quality dashboard.
Browser or Application Extension
The Alation Chrome Extension provides contextual quality insights.
Consolidated quality summaries and alerts directly within external applications such as Slack or Microsoft Teams.
Catalog Integration
Find the data quality information in the Quality widgets embedded in catalog pages (tables, columns, schemas) and accessible via the right-side collapsible menu for immediate quality context, For more information, see Accessing Data Quality in Catalog Pages.
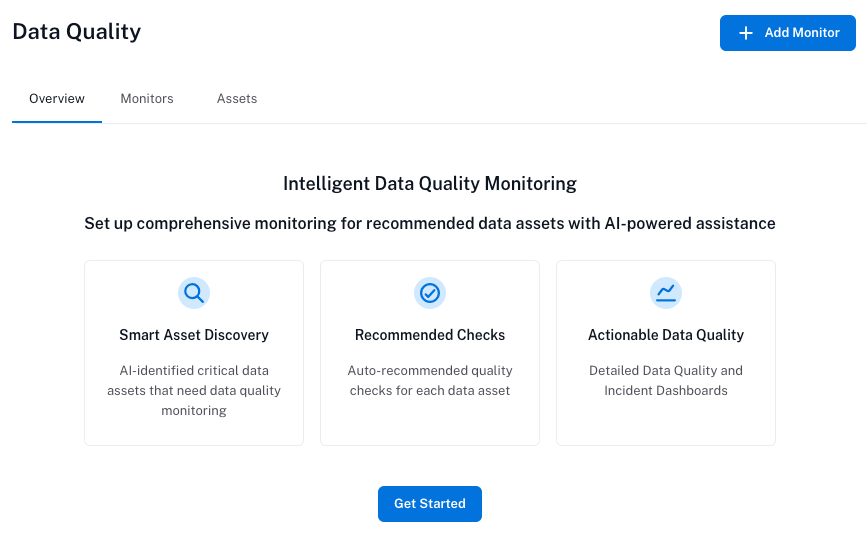
The Composer, Explorer, or Viewer user roles can open and view the data quality data in the catalog. Before anyone can view it, users with Server Admin, Source Admin, or Data Steward roles must configure and run at least one monitor so that the Data Quality information appears in the catalog. Before that, the Data Quality dashboard will be empty with nothing to view.
The screenshot below shows the Alation Data Quality dashboard when no monitor is configured:
Permission Framework
Alation Data Quality visibility and functionality are fully aligned with the permissions users already have within the Alation platform.
Object Access-Based Visibility
You can only view data quality checks, monitors, and results for tables and columns you have access to via Alation’s catalog permissions. If you lack access to an object, it will be excluded from your data quality views and dashboards.
Partial Access Handling
In instances where you have partial access to datasets within a monitor, you will receive descriptive messages explaining why certain items are restricted. This ensures transparency while maintaining security boundaries.
Role-Based Access to Configuration
The user roles such as Server Admin, Catalog Admin, Source Admin, or Steward are permitted to create and configure data quality checks and monitors. These roles typically reflect individuals responsible for data governance and quality enforcement.
Read-Only Access to Data Quality Information
All other users, such as Composers, Explorers, or Viewers have read-only access to view the results of existing monitors. Again, they can only view the data assets they are permitted to see. They cannot create or edit checks.
For information on permission access, see Permission Management.
Server, Catalog, or Source Admin |
Steward |
Composer |
Explorer |
Viewer |
|
|---|---|---|---|---|---|
Access the Data Quality dashboard |
Yes |
Yes |
Yes |
Yes |
Yes |
View the Data Quality information on catalog pages of assets |
Yes |
Yes |
Yes |
Yes |
Yes |
Add monitors |
Yes |
Yes |
No |
No |
No |
Edit monitors |
Yes |
Yes |
No |
No |
No |
Delete monitors |
Yes |
Yes |
No |
No |
No |
Run monitors |
Yes |
Yes |
No |
No |
No |
Recommend checks with AI |
Yes |
Yes |
No |
No |
No |
Configure Data Quality alerts |
Yes |
Yes |
No |
No |
No |
Receive Data Quality alerts |
Yes |
Yes |
Yes |
Yes |
Yes |
Access Data Quality in Alation Chrome Extension
Available from Alation Chrome Extension version 1.5.7
You can view a consolidated data quality summary of the data assets in Alation. This lets you quickly understand whether the data behind a chart or metric is reliable without opening the Alation Data Quality application.
You can:
View the data quality check types
Check monitor status (fail, error, partial, or pass)
Review recent incidents
Access Data Quality on Catalog Pages
You can access the Alation Data Quality widget directly on catalog pages for tables, columns, and schemas on the right side of the page in a collapsible panel.
In the widget, you can click View in Alation or Lineage Preview to get deeper insights.
This information helps you to:
Instantly assess data trustworthiness while exploring metadata
Quickly identify problem areas for operational datasets
View the Monitor summary that displays the monitors linked to the object, along with their status (fail, error, partial, or pass), schedule, and the number of applicable checks.
Only the checks from each monitor that are relevant to this object are included, so the check count reflects the subset specific to this table not the total number of checks defined in the monitor.
Permissions and Access in Data Quality Widgets
For legacy permission settings, users can access the redirection links to the monitor page regardless of role.
For role-based permission settings:
If a user role has
Can viewaccess, the Alation Data Quality widget is visible and a redirection link to the monitor page is also accessible.If a user role doesn’t have
Can viewaccess, the Alation Data Quality widget is visible but a redirection link to the monitor page is not available.