Troubleshoot the Agent
Alation Cloud Service Applies to Alation Cloud Service instances of Alation
Important
You are viewing documentation for Alation’s Classic User Experience.
This section will help you troubleshoot issues with the Agent. Issues may include:
Agent is in a “Disconnected” status.
Agent connectors are in an “Unknown” status.
Error when installing new connectors.
If network interruptions ever break the connection between the Agent and your Alation Cloud instance, the Agent will attempt to reconnect. It keeps trying to connect using an exponential backoff algorithm. Once the Agent can connect to your Alation Cloud instance again, it will reauthenticate and reestablish a secure connection.
Any jobs, such as metadata extraction, that were underway will automatically restart as long as the connection is reestablished within 30 seconds. If it takes longer than that, you’ll have to restart the job manually.
Diagnose Agent Connectivity Problems
Applies to Agent versions 1.5.0.2541 and later
Alation Agent versions 1.5.0.2541 and later come packaged with a suite of diagnostics that you can use to troubleshoot connectivity issues when deploying the Agent. These checks include (but are not limited to):
Operating system, memory, and CPU compatibility.
Configuration of the Agent.
Expired or revoked security certificates.
Issues related to DNS resolution and establishment of a TCP connection to Alation Cloud Service.
To use the diagnostic tools, log into the Agent host machine. Some of the most useful commands are shown below.
To get help information about the diagnostics tool:
kratos diagnostics help
To save the logs for all Agent components, including connectors, to the /tmp directory:
kratos diagnostics logs -o /tmp
To get a list of available diagnostics:
kratos diagnostics list
To run all diagnostics and save the results to a file:
kratos diagnostics run >> agent_diagnostics.yaml
You can send the resulting file, which includes the output logs of the diagnostics, to Alation Support to enable faster diagnosis of Agent connectivity problems.
Check the System Requirements
Verify that the Agent’s host machine meets the Agent System Requirements.
Check the Agent Version
Ensure that you have installed the latest version of the Agent.
On the Agent host machine, check the installed Agent’s version by running:
hydra versionThe version number will be in the first line of the output.
Go to the Alation Customer Portal. If prompted, log in.
On the Alation Customer Portal, check the latest version number under the Version column. If it’s newer than the Agent you have installed, upgrade the Agent.
Check the Agent’s Status
As a troubleshooting step, or when starting and stopping the Agent, you may want to check the Agent’s status.
Agent Status in Alation
In Alation, you can check the Agent’s connection status by visiting Admin Settings > Agents.
In Alation, you can check the Agent’s connection status by visiting Admin Settings > Manage Connectors > Agents Dashboard.
The Agent’s Status tells you if your Alation Cloud instance can reach the Agent.
Agent Status on the Agent’s Machine
You can check the status of the Agent’s individual components on the Agent’s host machine. To check the status, run the following command:
sudo docker ps
This command will output a list of running Docker containers. A normally functioning Agent will show several containers:
agent: This is the component that manages the connectors that are installed on the Agent.
proxy: This is the component of the Agent that communicates with Alation Cloud Service.
auth: This is the Authentication Service add-on, if installed.
connector_[n]: Each connector will be listed with n representing the connector’s ID.
Note
If the Query Service Add-on is installed, its components (queryservice, traefik, and zerodatahealth) run as k3s pods and don’t appear in docker ps output. To check their status, run sudo k3s kubectl get pods -A. See Troubleshoot the Query Service Add-on for details.
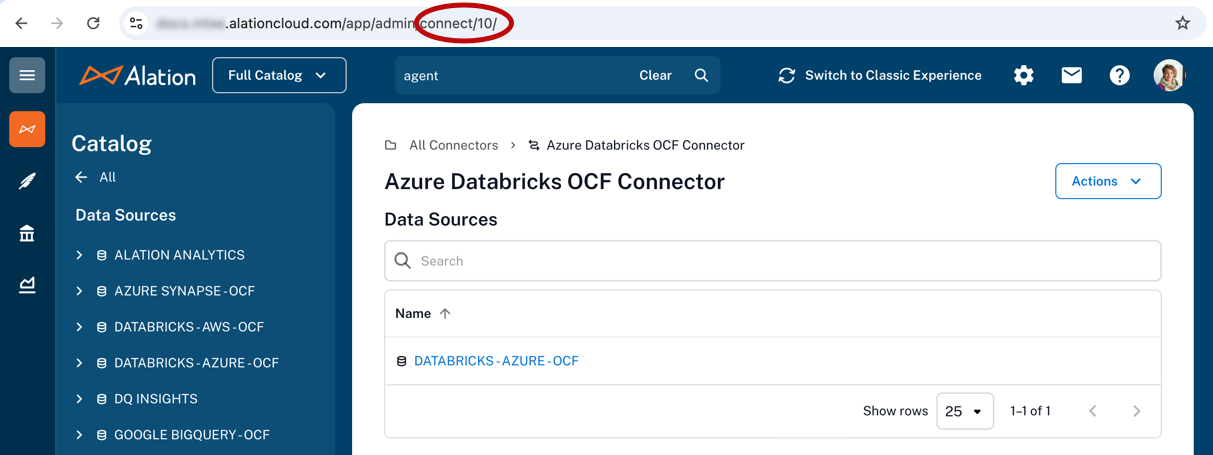
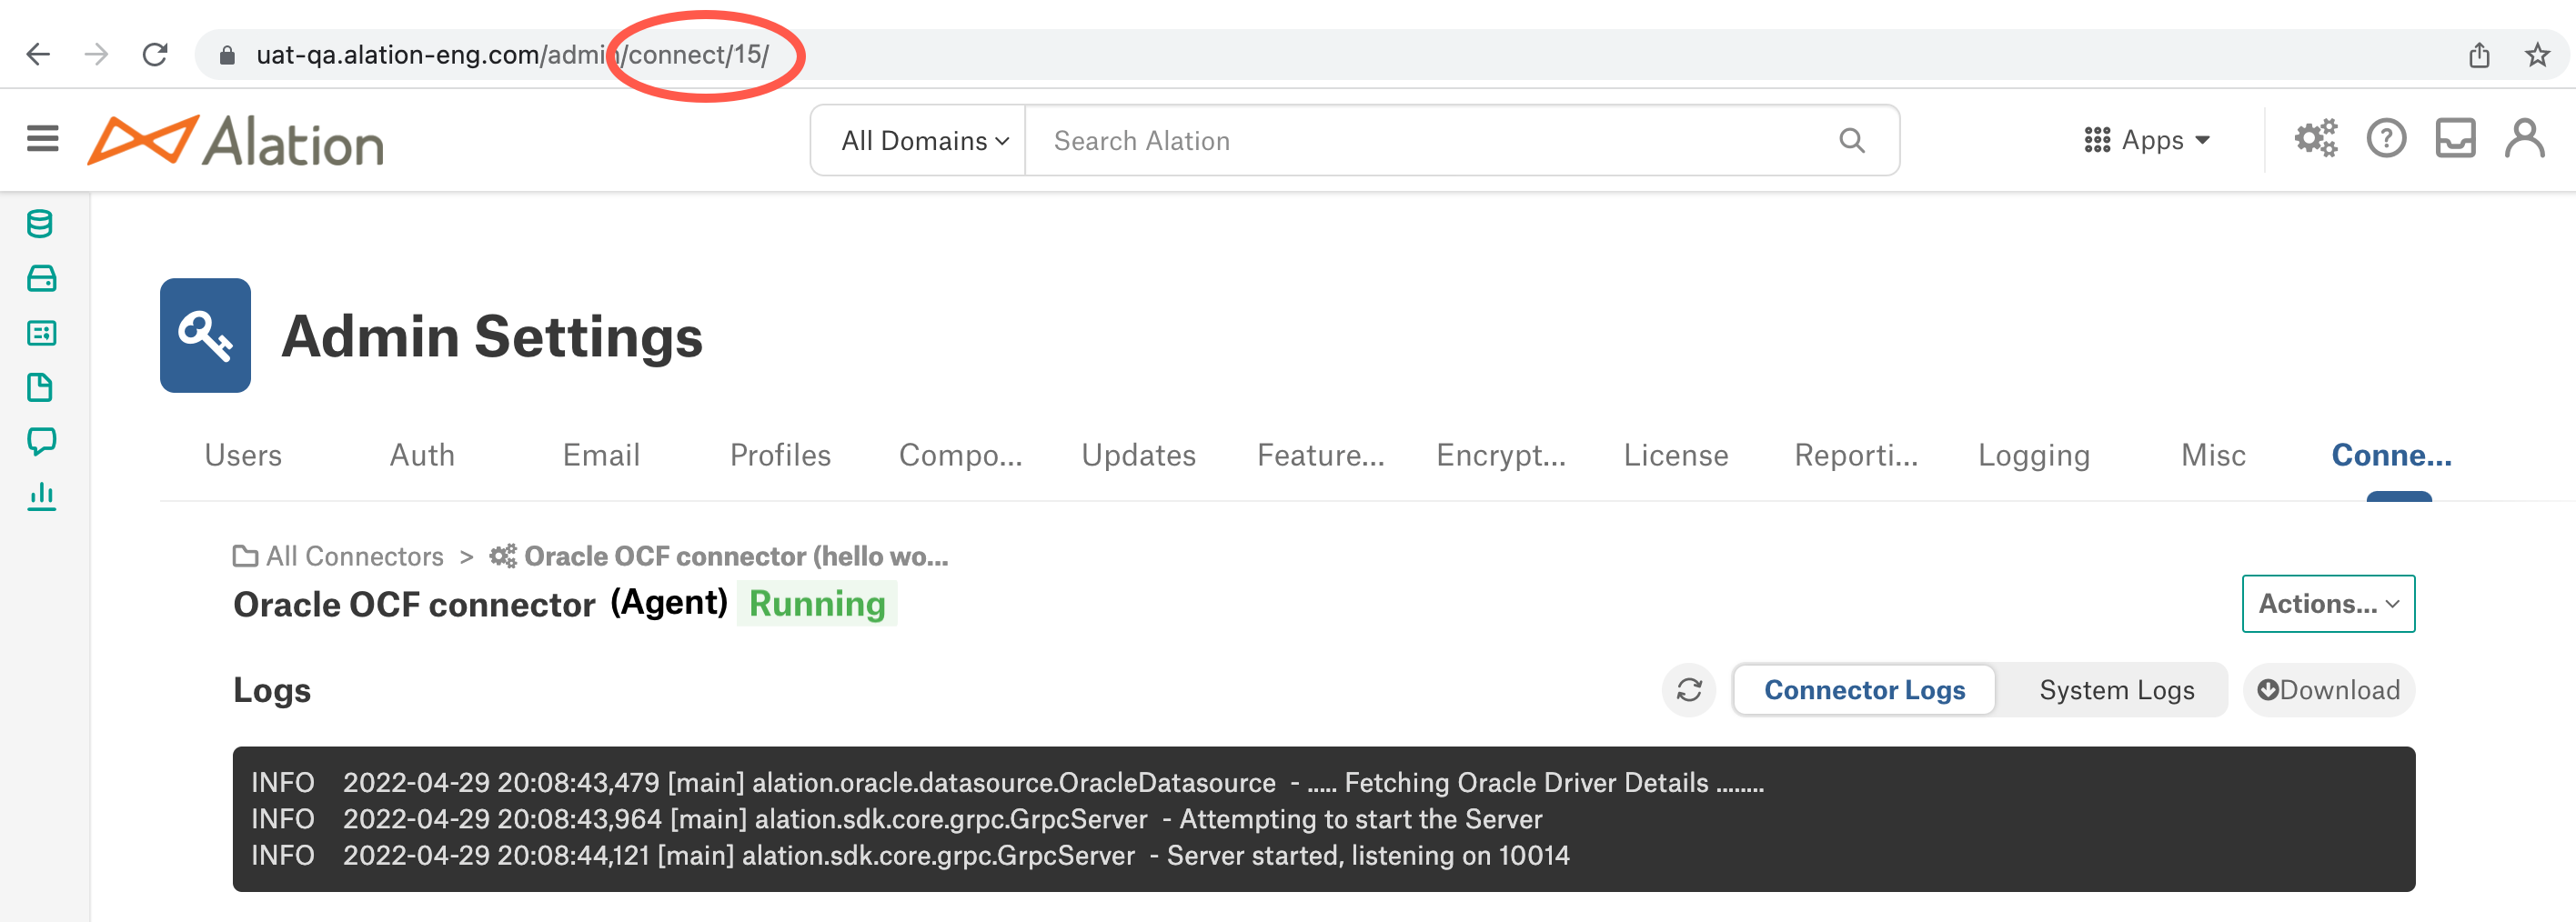
You can correlate the ID with the connectors on the Connectors Dashboard in Alation by clicking on a connector and viewing its URL.
If any components are missing from the list, that means they are not running. You can try to restart the Agent and its components using the instructions below.
Restart Agent Components
To start up Agent components that are not running, you can try the following steps:
Restart the Agent by running the following command on the Agent’s host machine:
sudo hydra restart
Restart Docker:
sudo systemctl restart docker
Check the status of the Agent’s components again:
sudo docker ps
Check the Certificates
If the Agent shows as disconnected, it may be that the Agent’s certificates have expired or been revoked. The certificates expire automatically after one year.
To check if the Agent has valid certificates, see View the Certificates’ Expiration Date. If the Agent does not have valid certificates, see Renew the Certificates to reestablish the connection. Do not add a new Agent, as doing so will not solve problems with certificates and may cause additional problems.
Update the Agent’s Address Configuration
If the Agent is in a disconnected status, you may need to update the Agent’s address configuration. For instructions, see Configure Agent Address.
Check Agent Error Messages
To view Agent error messages, run the following command on the Agent’s host machine:
sudo systemctl status hydra.service
Check Logs
Each component of the Agent writes its own logs on the Agent host machine. Each connector that’s installed on the Agent also has its own logs. On the Agent machine, you can get an archive of all logs or check the logs for each component and connector separately. Connector logs are also available directly in Alation.
All Logs
You can get an archive of all Agent component logs, including connector logs, using the Agent diagnostics tool on the Agent machine.
To save all Agent logs to the current working directory:
kratos diagnostics logs
To save all Agent logs to a specified directory:
kratos diagnostics logs -o /tmp
Agent Component Logs
To check the Agent’s logs, you’ll need to know the name of the Docker container for the component you’re checking. To get the names of the containers, run the following command on the Agent’s host machine:
sudo docker ps
In the output, the NAMES column shows a list of the Agent’s components.
agent: This is the component that manages the connectors that are installed on the Agent.
proxy: This is the component of the Agent that communicates with Alation Cloud Service.
auth: This is the Authentication Service add-on, if installed.
connector_[n]: Each connector will be listed with n representing the connector’s ID.
Note
If the Query Service Add-on is installed, its components (queryservice, traefik, and zerodatahealth) run as k3s pods and don’t appear in docker ps output. To check their status, run sudo k3s kubectl get pods -A. See Troubleshoot the Query Service Add-on for details.
You can correlate the ID with the connectors on the Connectors Dashboard in Alation by clicking on a connector and viewing its URL.
Access the logs using the docker logs command followed by the name of the container. For example:
# tail logs for Alation Connector Manager component
docker logs -f agent
# tail logs for proxy component
docker logs -f proxy
# tail logs for the Authentication Service add-on, if installed
docker logs -f auth
# save logs to a file
docker logs agent >& agent.logs 2>&1
docker logs proxy >& agent.logs 2>&1
Query Service Add-on Logs
You can download the Query Service Add-on logs directly from the Alation UI:
Click on the Settings icon in the top right corner.


The Admin Settings page appears. Under the Platform Settings section, click Agents.
Under the Server Admin section, click Manage Connectors. Then click the Agents tab. The Agents Dashboard appears.
Click the Agent name to open the Agent detail view.
Click the Agent Action menu.
In the menu, locate the Download Logs section and download the logs.
Connector Logs
Each OCF connector has logs that record information about actions such as metadata extraction and query log ingestion. Logs for OCF connectors installed on the Agent are available from the Connectors Dashboard. See Connector Logs for more information.
To view OCF connector logs on the Agent’s host machine:
Get the ID of the connector by running
kratos listand looking for the “id” field. Or runsudo docker psand look for the number following the underscore in the container name.Use the commands below to work with the connector logs as desired:
# Tail logs
kratos tail <ID>

# Get full logs
kratos logs <ID>

# Get logs from a specific date
kratos logs --since 2024-08-15 <ID>

# Redirect logs to a file
kratos logs <ID> > connector_3.log 2>&1
Troubleshoot the Query Service Add-on
If the Query Service Add-on isn’t working correctly, use the following steps to diagnose the issue.
Check the Query Service Status (Healthcheck)
You can check the health of the Query Service Add-on directly from the Alation UI:
Click on the Settings icon in the top right corner.
The Admin Settings page appears. Under the Platform Settings section, click Agents.
Under the Server Admin section, click Manage Connectors. Then click the Agents tab. The Agents Dashboard appears.
Click the Agent name. Under Query Service, the health status appears.
The healthcheck reports on the following:
Whether the Query Service component is reachable
Whether the Traefik ingress gateway is reachable
Whether the object store bucket is accessible
Verify Browser Connectivity to the Agent
For Zero Data to work, the user’s browser must be able to reach the Agent’s ingress DNS endpoint directly. This is different from the standard Agent-to-Alation Cloud Service connection.
To verify connectivity:
Check that the Agent’s ingress DNS endpoint resolves from the user’s network. Use a tool such as
digornslookupfrom the user’s machine.Test connectivity to the ingress endpoint using the unauthenticated ping endpoint:
curl https://zerodata.yourcompany.com/_pingReplace
zerodata.yourcompany.comwith your actual ingress hostname. A successful response confirms the ingress is reachable.Ensure that any firewalls or network security groups allow inbound HTTPS (port 443) traffic to the Agent’s ingress endpoint from the user’s network. See Alation’s IP Addresses for Allow Lists for details.
Common Issues
Bucket permission errors
If query results fail to write or read, verify that the IAM role (AWS) or OIDC federated credential (Azure) has the necessary permissions on the bucket. See Bucket Security Requirements for the required permissions.
JWT token failures
If users see authentication errors when accessing query results, the JWT token may have expired or there may be a clock skew between the Agent and the browser. Verify that the Agent machine’s system clock is accurate.
Traefik not starting
If the Traefik pod fails to start, check the Traefik logs for certificate or configuration errors:
sudo k3s kubectl logs -n kube-system -l app.kubernetes.io/name=traefik
Run Diagnostics
Use the Agent’s built-in diagnostic tool to check the health of the Zero Data components:
kratos diagnostics run > agent_diagnostics.yaml
Send the resulting file to Alation Support if you need assistance troubleshooting the Query Service Add-on.