Manage Data Quality Incidents
Alation Cloud Service Applies to Alation Cloud Service instances of Alation
Incident management allows a centralized view to see the status of issues that have been escalated from failed checks or anomalies, track their priority, and navigate directly to the source monitor or the external ticket.
Prerequisites
The Incident Management Service (IMS) and Data Quality monitoring must be enabled.
Ensure that you have admin access to the following incident reporting tools:
Atlassian Jira
ServiceNow ITSM
Platform version must be Yokohama or later.
You must have the
adminrole in your ServiceNow instance.The System Import Sets plugin must be enabled.
Ensure that you have the following details:
Your Alation instance URL (for example,
your-company.alationcloud.com)Your Alation Tenant ID
A notification email address for the integration’s service account
Integrate Atlassian Jira
Alation Integration for Jira is available in the Atlassian marketplace for Server Admins or Atlassian app admins to configure and integrate Atlassian Jira as an incident management system for Alation.
To integrate:
In Alation Catalog, click addons icon in the lower left corner of the screen.
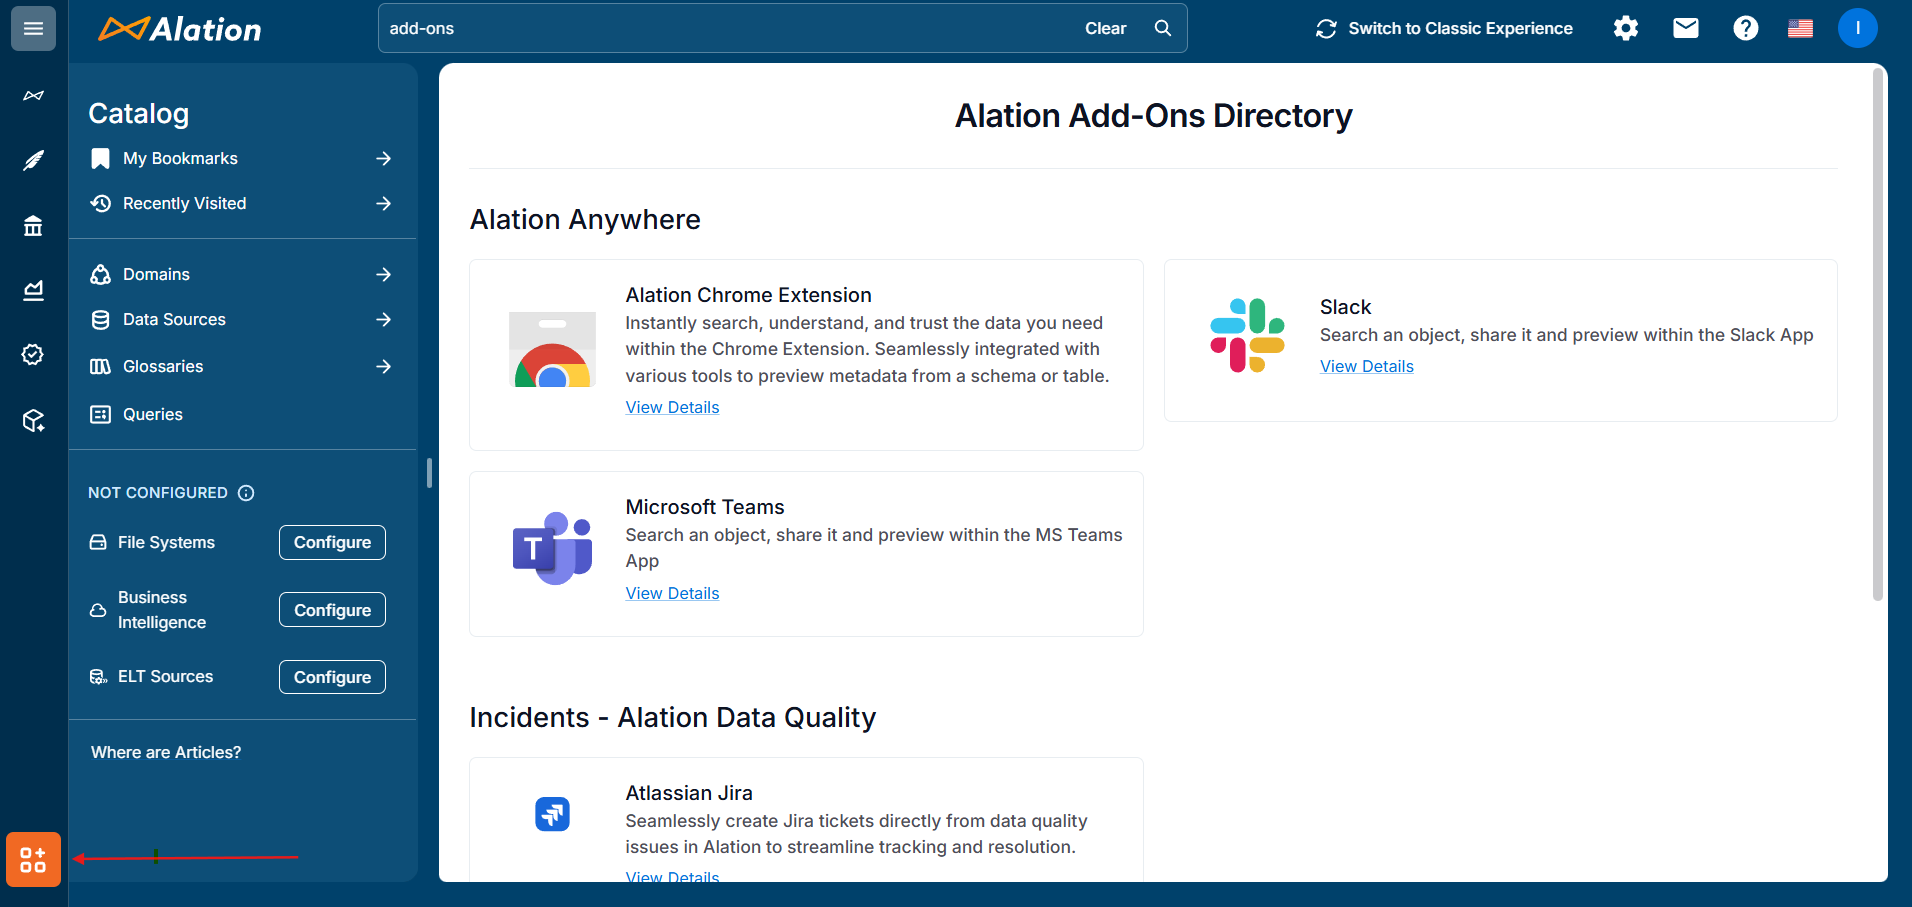
In Incidents - Alation Data Quality, click View Details under Atlassian Jira to open Atlassian marketplace.
Alation Integration for Jira application appears in Atlassian marketplace.
In Alation Integration for Jira, click Get it Now to download the application.
Choose the Alation site to install it.
The application is installed in your Atlassian Jira instance.
In your Atlassian Jira instance, click on the installed application to open Alation Jira App Settings page.
Enter the following details:
Alation site host
Alation Tenant ID: You can find the tenant ID from the URL:
https://<alation-host-url>/app/build-info.
Click Save.
Integrate ServiceNow
The Alation ServiceNow Incident Integration app is available in the ServiceNow Store. A Server Admin or ServiceNow administrator can configure it to use ServiceNow as the incident management system for Alation.
As a ServiceNow administrator, you must install the Alation application, create an OAuth endpoint, and set up a dedicated user account for the integration.
Install the Alation Application
To install the Alation application:
In ServiceNow, navigate to System Applications > All Available Applications.
Search for Alation Integration for ServiceNow.
Click Install and follow the on-screen prompts.
After installation, verify that the application appears under My Company Applications.
Create an OAuth Endpoint
To create a secure connection endpoint for Alation:
Navigate to System OAuth > Application Registry.
Click New, then click Create an OAuth API endpoint for external clients.
In the Name field, enter
Alation Integration OAuth.Important
The name must be an exact match, including capitalization. The integration will fail if the name is different.
Copy the auto-generated Client ID and save it in a secure location.
Click Generate Secret. Copy the new client secret and store it securely.
Ensure the Active checkbox is selected and the Accessible From field is set to All application scopes.
Create the Integration User
To create a dedicated service account for the integration:
Navigate to User Administration > Users and click New.
Fill in the user details:
User ID:
alation_integrationFirst Name:
AlationLast Name:
IntegrationEmail: The notification email address you gathered earlier.
Set a strong password for this user.
After creating the user, select the Roles tab and add the following two roles:
x_alati_snow_intgr.admin: Grants full access to the integration application.
import_set_loader: Allows the integration to process incoming data from Alation.
Configure the Connection
To finalize the setup in ServiceNow:
In the ServiceNow navigator, search for and open Alation SNow Integration UI.
Enter the following details:
Alation Host: Your Alation instance URL (for example,
your-company.alationcloud.com).Note
Do not include
https://.Tenant ID: Your Alation Tenant ID.
OAuth Registry Name: This field should auto-populate with Alation Integration OAuth.
Client Secret: Paste the client secret you saved.
Username and Password: Enter the credentials for the
alation_integrationuser.
Click Save Configuration.
Saving the configuration automatically registers your ServiceNow instance with Alation’s Incident Management Service.
Create or Link an Incident to a Check
You can create incidents from checks that have failed, errored, or detected anomalies. This allows you to track and manage data quality issues in your incident management system.
Navigate to the Alation Data Quality application and from the left-pane menu, click the Monitors tab.
Click on a monitor name to view its details.
Go to Check Results to view the Data Quality job status.
Click View Details for a job.
In Details of Job ID: XXX section, click on three dots (…) after Status Message column for more options.
For a failed check, click Create New Incident for a new ticket or Link to an Existing Incident if you already have one (from monitor setup process).
Select the failed issues that you want to be included in the incident.
For Atlassian Jira:
Select
Jirafrom the Ticket Management System option.Enter a Jira Project Key.
Select an Issue Type.
Define the Incident Title (Optional) and Description (Optional).
Select the Assignee (Optional) and Priority (Optional).
To add any other additional fields, select a field, enter its value, and click + Add Field.
For ServiceNow:
Select
ServiceNowfrom the Ticket Management System option.Enter an Incident ID and brief Summary.
Fill in the optional fields:
Select Urgency level. Available options:
1-High (4 hrs),2-Medium (24 hrs), or3-Low (72 hrs).Define the Impact. Available options:
1-High (multiple depts),2-Medium (single dept), or3-Low (individual).Define the Category. Available options:
Database,Software,Hardware, orNetwork.Enter an Assignment Group based on your ServiceNow groups (Team responsible for resolution.)
Enter detailed information in Description.
Click Create Incident.
Link Detected Anomaly to an Incident
When the warm-up period is over, the anomalies get detected automatically. The time series graph shows the timeline when the monitor starts detecting the anomalies. You can then link the detected anomaly to an incident.
Navigate to the Alation Data Quality application and from the left-pane menu, click the Monitors tab.
Click on a monitor name to view its details.
Click Anomaly Metrics.
You can view the applied anomaly metrics on table and columns.
Click on an anomaly.
The time-series graph reflects the following data:
Actual,Expected Range,Missing,Detected Anomalies.Hover over the dots on the graph to view more details for a detected anomaly showing the actual and expected data.
Use the Link to an Existing Incident to link the detected anomaly to an incident.
Enable Automatic Incident Creation in Alation
To configure a Data Quality monitor to automatically create ServiceNow or Atlassian Jira incidents:
Navigate to the Alation Data Quality application and from the left-pane menu, click the Monitors tab.
Select the monitor you want to configure.
Go to the Settings tab.
In the incident management section, configure your preferences:
Select the Auto-Create Incident checkbox.
Select ServiceNow or Jira as the provider.
ServiceNow: Fill in the default incident details, such as the Incident ID, Summary, Assignment Group, Urgency, Impact, Category, and Description for ServiceNow. The values assignment group, urgency, and impact gets pre-populated in the incident ticket in ServiceNow.
Jira: Fill in the Jira details, such as Jira Project Key, Issue Type, Incident Title (optional), Description (optional), Assignee (optional), and Priority (optional).