


A knowledge graph is a business model: an ontology of what things exist and how they connect, populated with your real, governed data. It's the fix for a specific, well-documented failure mode: Gartner predicts that through 2026, organizations will abandon 60% of AI projects unsupported by AI-ready data.⁷ Usually, it isn't the model that's the problem — it's that the data underneath has no explicit structure for the model to reason over.
Instead of storing "Customer," "Order," "Product," and "Warranty" as disconnected columns in a spreadsheet, a knowledge graph tells you, explicitly, that a customer places an order, an order contains a product, and a product is covered by a warranty. Then it links that model to the actual rows of data behind each concept, so a person or an AI agent can walk from one connected fact to the next instead of guessing.
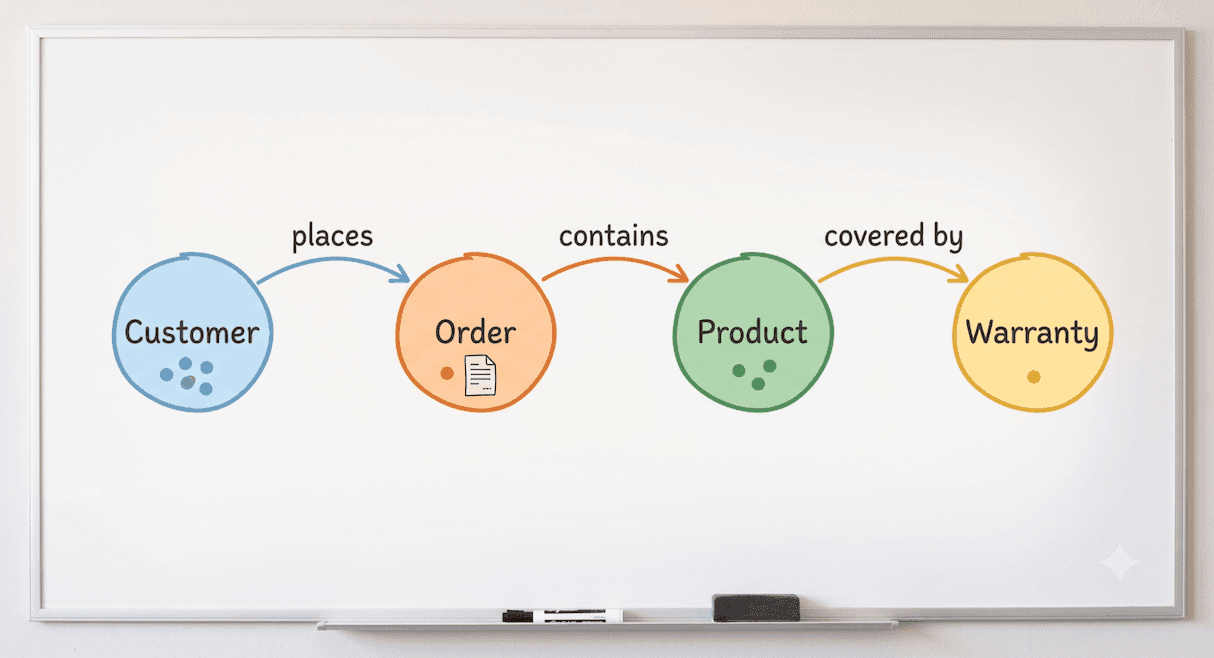
The customer-order-product-warranty example
Picture a spreadsheet with four columns: Customer, Order, Product, Warranty. The spreadsheet shows you what's in each column. It doesn't tell you how they relate. If you ask a general-purpose AI tool, "Is this customer's product still under warranty?", it has to guess at the relationship — infer that this customer's name probably matches this order, which probably contains this product, which probably has this warranty record. Most of the time, on clean data, that works. On messy enterprise data, at scale, it doesn't.
A knowledge graph makes those relationships explicit and structured instead of implied. It states, as a rule, that every order belongs to exactly one customer, every order contains one or more products, and every product maps to a warranty record. An AI agent given that structure doesn't guess, it traverses. Customer → Order → Product → Warranty, hop by hop, with each step deterministic instead of probabilistic. That's the practical difference between an agent that's usually right and one that's reliably right.
Knowledge graph vs. ontology vs. semantic layer vs. data catalog
These four terms get used almost interchangeably in vendor conversations, and the confusion isn't accidental — it's a symptom of an industry that leads with architecture and trails with outcomes. Here's what each one actually does, and how they relate:
Term | What it actually is | What it does well | What it can't do alone |
The governed inventory of what data you have — tables, columns, owners, definitions, quality, lineage | Tells you what data exists and whether you can trust it | Doesn't formally model how business concepts relate to each other | |
A translation layer that standardizes how metrics are calculated and named | Makes sure "revenue" means the same thing to every team and tool asking for it | Can't explain why a number changed or what should happen next | |
Ontology | The formal model of what things are and how they connect — Customer, Order, Product, Warranty, and the rules between them | Structured reasoning, multi-hop inference, consistent business logic | Goes stale fast if nothing keeps it in sync with a changing business |
Knowledge graph | The ontology, populated with your real, linked data | Lets a person or agent walk from one connected fact to the next | Only as trustworthy as the governed metadata and data quality feeding it |
The important thing to notice is that these aren't competing choices. They're nested. A knowledge graph lives inside the ontology layer: it's the ontology's model, instantiated against real data that a catalog has already made trustworthy. Pick one in isolation, and you'll eventually need the others anyway.
Why the "graph" part actually matters
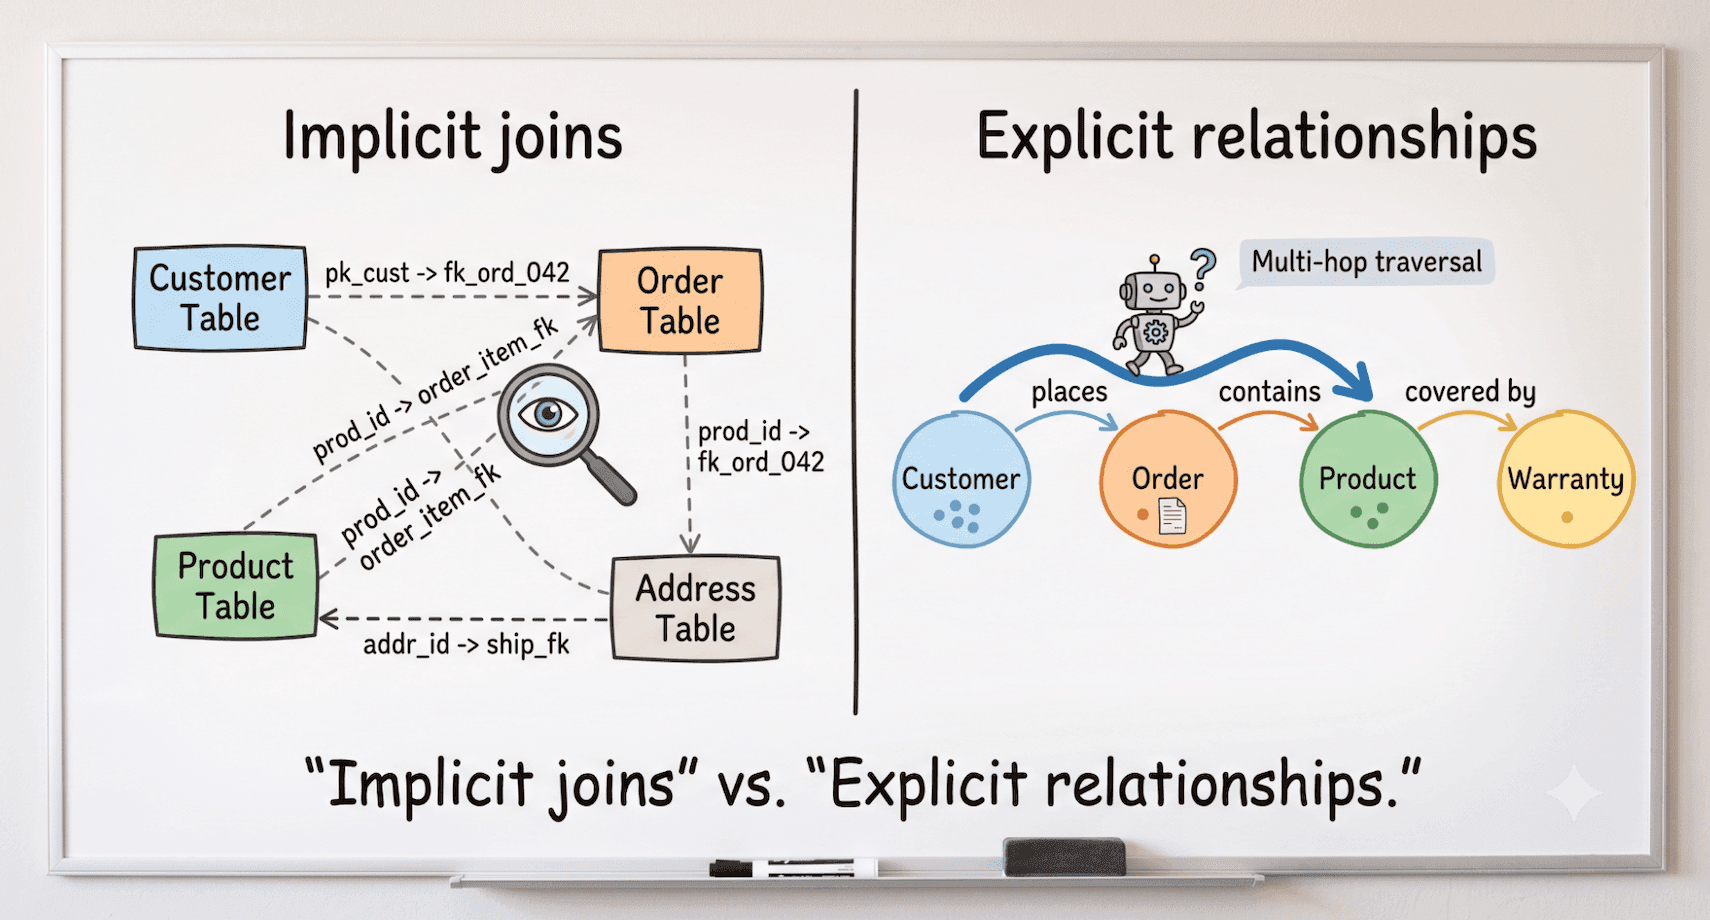
In a relational database, relationships are implicit — they live in foreign keys, join conditions, and institutional knowledge about which columns connect to which. Answering "which customers share a billing address with someone who returned a product within 30 days" means writing a chain of joins that gets more fragile every time the schema changes.
In a graph, relationships are first-class objects, not side effects of table design. You don't join your way to the answer; you walk the edge. That's a meaningful architectural difference for AI agents specifically, because multi-hop reasoning (moving from one connected entity to the next, several times, to answer a compound question) is exactly the kind of task that trips up an agent working from flat, unstructured retrieval. A well-built knowledge graph turns "hope the model infers the right join" into "follow the explicit relationship."
Knowledge graph vs. graph database
This is the single most common point of confusion, so it's worth being precise: a knowledge graph and a graph database are not the same thing, even though the terms get used interchangeably in vendor pitches.
A graph database (think Neo4j or Amazon Neptune) is, by its own maker's description⁴, a storage and query engine built to store nodes and edges efficiently and query them fast; AWS positions Neptune the same way⁵, as a fully managed graph database service for applications built on highly connected data. Neither vendor's own product page describes business-definition, lineage, or governance capabilities — that's a different layer of the problem, and one a knowledge graph has to bring on its own. It's a very good place to put a graph. It is not, by itself, a source of business meaning.
A knowledge graph is the model plus the meaning: the governed entities, the relationships between them, and the business context that makes those relationships trustworthy. You can absolutely store a knowledge graph inside a graph database, and plenty of organizations do, exporting an ontology in an open, portable format like RDF or OWL and loading it into whichever storage engine fits their scale requirements. The graph database is the container. The knowledge graph is what's inside it, and where that content comes from (and how well it's maintained) is the part that determines whether the whole exercise is worth doing.
The part most vendors skip: governance and data quality
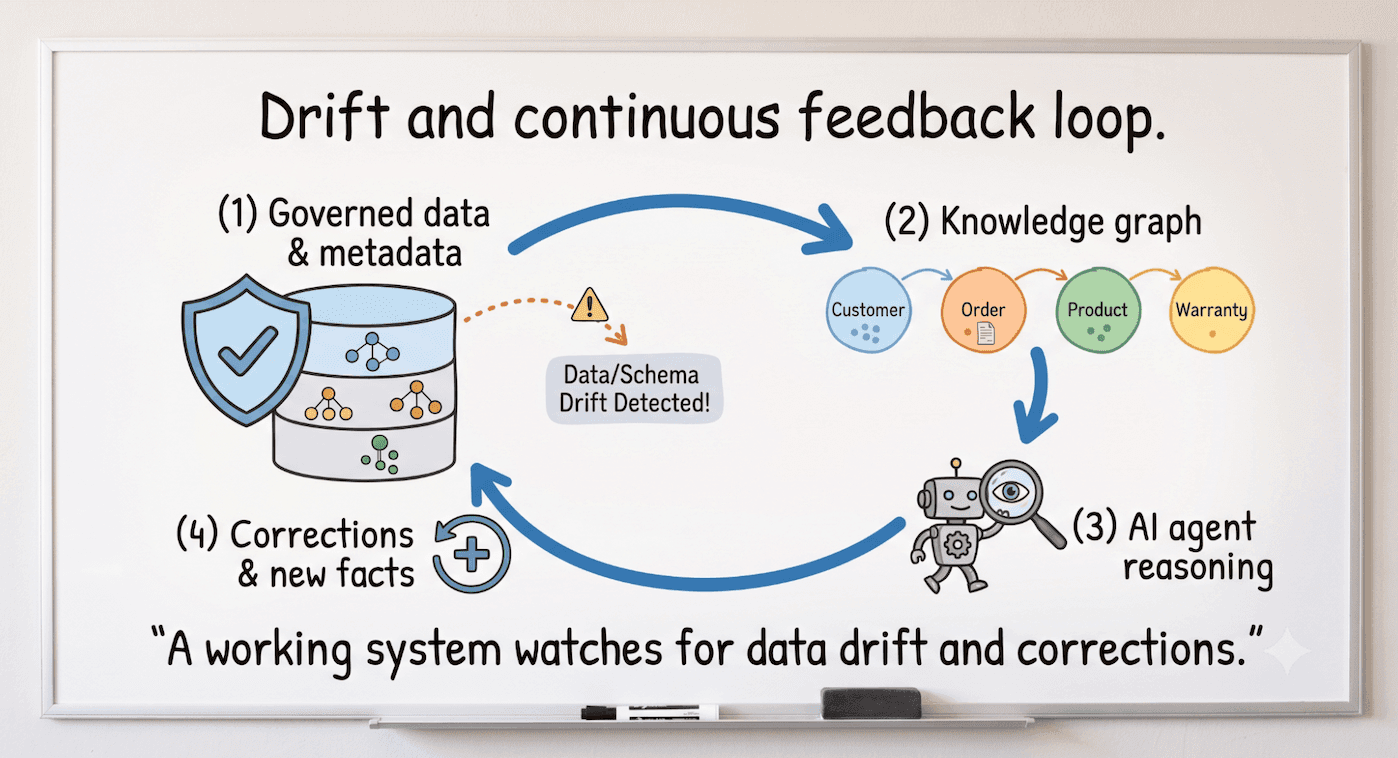
Here's what a lot of "quick start" knowledge graph projects leave out: a graph is only as trustworthy as the data feeding it, and enterprise data doesn't hold still. Tables get deprecated. Columns get renamed or deleted. Definitions of "active customer" change between quarters. If nothing is watching for that drift, your knowledge graph fails quietly, by confidently answering questions with data that no longer means what the graph says it means.
This is why data quality monitoring has to be treated as part of the knowledge graph architecture, not a separate concern bolted on afterward. Freshness checks catch data that stops arriving on schedule. Schema drift detection catches structural changes before an agent queries a column that no longer exists. And governed metadata (encompassing ownership, certification, and curation) is what separates a graph that's merely auto-generated from table relationships from one that a business can actually rely on for decisions.
The organizations getting real value out of a knowledge graph have also built a working feedback loop, not a one-time export. Two mechanisms make that possible: a system that captures what happens when an agent gets an answer wrong or a user corrects it, and automatically routes that signal back into the underlying model instead of into a ticket queue that someone may or may not get to… and continuous data quality monitoring underneath, checking that the data feeding the graph is still fresh and structurally intact before an agent ever queries it.
The proof is in what that loop actually does, and it shows up differently depending on which part of the system was actually broken. In one evaluation benchmark¹, a SQL agent's accuracy went from 60% to 100% in two iterations because each failed test case was traced back to the specific metadata gap that caused it, the metadata was corrected, and the agent was re-tested, with a person reviewing every change before it took effect. That's a fix at the mechanism level: the loop itself.
Georgia-Pacific² shows what happens when the data underneath the graph is the problem, rather than the relationships: once real-time data quality signals were wired directly into the catalog feeding 200-plus manufacturing sites, roughly $25 million in duplicated inventory spend, invisible for years because nobody trusted the underlying numbers, became visible and correctable.
That's the practical difference a feedback loop makes. Without one, a knowledge graph is a snapshot that starts decaying the day it ships. With one, every agent interaction becomes a signal that makes the graph, and everything built on top of it, more accurate over time.
How to evaluate a knowledge graph initiative
Before investing in a knowledge graph project — whether you're building on a graph database, a catalog, or some combination — it's worth answering a few honest questions:
Do you have a governed source of truth underneath it? A knowledge graph built on ungoverned, uncataloged data inherits every inconsistency in that data, just faster.
Is there a business glossary your organization actually agrees on? If "active customer" means three different things to three different teams, the graph will encode whichever definition someone happened to use first — see business glossary vs. data dictionary for how these should work together.
Do you have lineage visibility into how data flows and transforms across systems? Without it, you can't tell what a node in your graph actually represents or where it came from.
Is there a mechanism to catch drift and feed corrections back in? A knowledge graph without an update mechanism is a document pretending to be a system.
What's the actual business problem? "We need a knowledge graph" is a technology answer. "Our agents keep giving wrong answers because they can't tell how our data connects" is a business problem — and it's the one worth solving first.
Most organizations find that the honest answer to question one is "not yet" — and that the highest-leverage first step isn't standing up a graph database at all, but making sure the data underneath it is governed and trustworthy in the first place. Data catalogs already do a version of this connective work today. As Gartner has noted in its data fabric research⁶, a key step in activating metadata is applying graph analytics to it and enriching the resulting knowledge graph with business semantics — surfacing the relationships between data assets is a capability many organizations already have more of than they realize.
Where this fits in the bigger picture
A knowledge graph isn't a standalone project — it's one layer in a larger stack that also includes the semantic layer underneath it and, increasingly, the judgment and policy context that autonomous AI agents need to act safely on top of it. Understanding where a knowledge graph fits relative to those other layers — and which one is actually your bottleneck — matters more than picking a storage format.
If you're evaluating a knowledge graph initiative, the highest-value question isn't "which vendor has the best graph technology." It's "what's the actual business problem, and do we have the governed foundation this needs to sit on." Get that right, and the graph itself becomes the easy part.
Sources & notes
Every external claim on this page is independently verifiable. The sources are listed here.
SQL agent accuracy improved from 60% to 100% across two evaluation iterations. — Alation, "AI Agent Evaluations: How to Build Reliable SQL Agents," March 10, 2026 — https://www.alation.com/blog/ai-agent-evaluations/
Georgia-Pacific: over 200 manufacturing sites, ~$25 million in intercompany transfers recovered. — Alation, "The $25 Million Reason Georgia-Pacific Rebuilt Its Data Foundation," April 6, 2026 — https://www.alation.com/blog/georgia-pacific-data-transformation-matt-robuck/
[source removed]
Neo4j product description. — Neo4j, "Native Graph Database," accessed July 15, 2026 — https://neo4j.com/product/neo4j-graph-database/
Amazon Neptune product description. — Amazon Web Services, "Amazon Neptune," accessed July 15, 2026 — https://aws.amazon.com/neptune/
Activating metadata via graph analytics and knowledge graph semantics. — Gartner, "What is Data Fabric? Uses, Definition & Trends," accessed July 15, 2026 — https://www.gartner.com/en/data-analytics/topics/data-fabric
Gartner predicts 60% of AI projects will be abandoned through 2026 due to lack of AI-ready data. — Gartner, "Lack of AI-Ready Data Puts AI Projects at Risk," Feb 26, 2025 — https://www.gartner.com/en/newsroom/press-releases/2025-02-26-lack-of-ai-ready-data-puts-ai-projects-at-risk
ANALYST ATTRIBUTIONS & DISCLAIMERS Gartner, "What is Data Fabric? Uses, Definition & Trends," gartner.com, accessed July 15, 2026. Gartner does not endorse any vendor, product or service depicted in its research publications and does not advise technology users to select only those vendors with the highest ratings or other designation. Gartner research publications consist of the opinions of Gartner's research organization and should not be construed as statements of fact. Gartner disclaims all warranties, expressed or implied, with respect to this research, including any warranties of merchantability or fitness for a particular purpose. GARTNER and Magic Quadrant are registered trademarks and service marks of Gartner, Inc. and/or its affiliates in the U.S. and internationally and are used herein with permission. All rights reserved.
- Active Data Governance
- Data Culture
- Data Intelligence
- Digital Transformation
- Engineering
- Enterprise Data Catalog
- AI
- Data Catalog
- Data Governance
- Data Quality
Keep reading
More from the data desk