Configure Sampling and Profiling
Alation Cloud Service Applies to Alation Cloud Service instances of Alation
Customer Managed Applies to customer-managed instances of Alation
Enhanced Connector Enhanced connectors add extended capabilities and require a separate entitlement in addition to your Alation platform license.
The MaxCompute connector supports data sampling and profiling to provide insights into your data directly in the Alation catalog.
Overview
Data Sampling: Retrieves sample rows from tables to display in the catalog.
Data Profiling: Calculates column statistics such as min, max, value distributions, and null counts.
Both features use JDBC connections to execute queries against MaxCompute tables.
Prerequisites
Before configuring sampling and profiling:
The MaxCompute data source must be configured with valid Access Key credentials in General Settings.
The RAM user must have permissions to read data from the target tables.
Note
Sampling and profiling use the service account credentials (Access Key ID / Access Key Secret) configured in General Settings. No per-user credential setup is needed. This is different from Compose, which requires each user to provide their own Access Key credentials.
The following permissions are required:
odps:Read- Read access to projects and tablesodps:List- List access to project resourcesodps:CreateInstance- Permission to submit SQL jobs for sampling and profiling queriesodps:SelectonINFORMATION_SCHEMA.PARTITIONS- Required for partitioned tables so the connector can resolve the latest partition automatically. Grant this per MaxCompute project that contains partitioned tables:GRANT Select ON TABLE <project_name>.INFORMATION_SCHEMA.PARTITIONS TO USER <ram_user>;
At the project level, grant the RAM user one of the following roles: Admin, Super_Administrator, or role_project_reader. Alternatively, grant specific permissions:
GRANT Read, CreateInstance ON PROJECT <project_name> TO USER <ram_user>;
For more information, see the Prerequisites page.
Additionally, metadata extraction must be completed for the tables you want to profile.
Configure Sampling and Profiling
On the MaxCompute data source Settings page, go to the Sampling and Profiling tab.
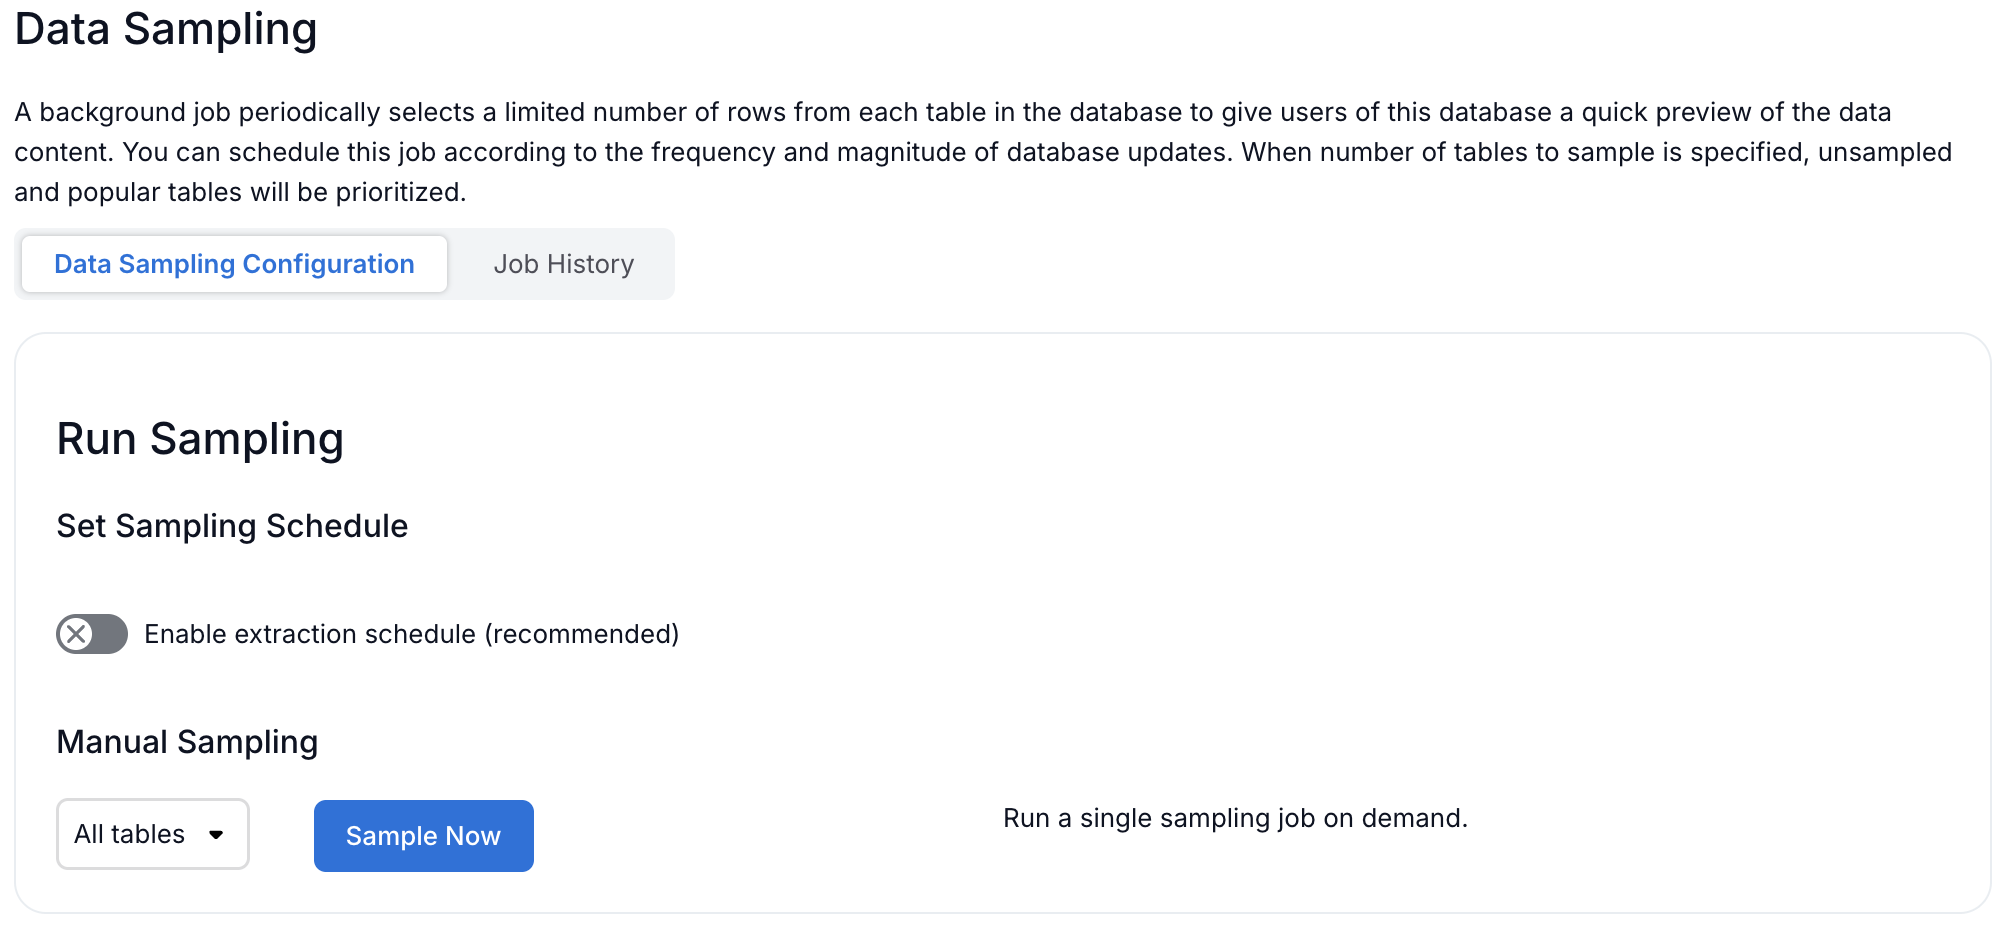
Configure the following settings:
Setting
Description
Enable Sampling
Turn on to enable data sampling for tables.
Sample Size
Number of rows to retrieve for sampling (default: 100).
Enable Profiling
Turn on to enable column profiling.
Click Save.
Running Profiling
To run profiling on a table:
Navigate to the table’s catalog page in Alation.
Click the Samples tab to view sample data.
Click Profile to run column profiling.
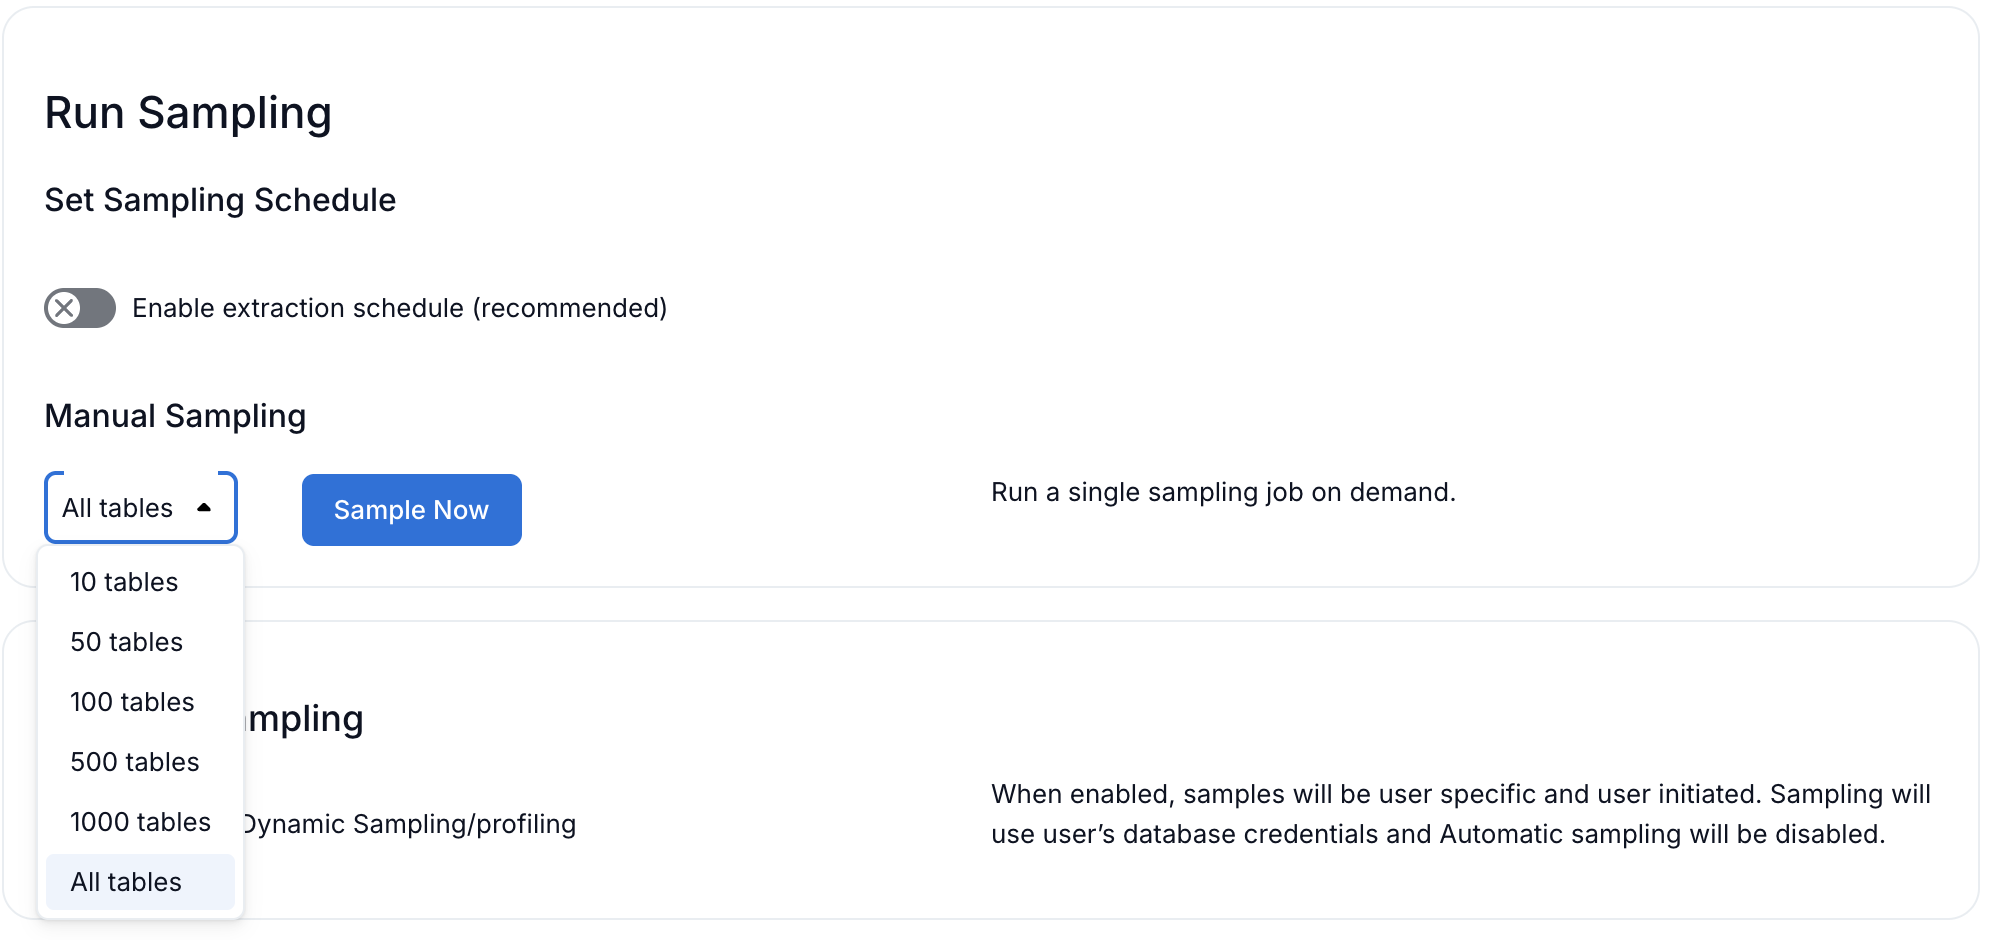
Alternatively, you can schedule profiling to run automatically:
On the Sampling and Profiling tab, configure the profiling schedule.
Select the frequency (daily, weekly) and time.
Click Save.
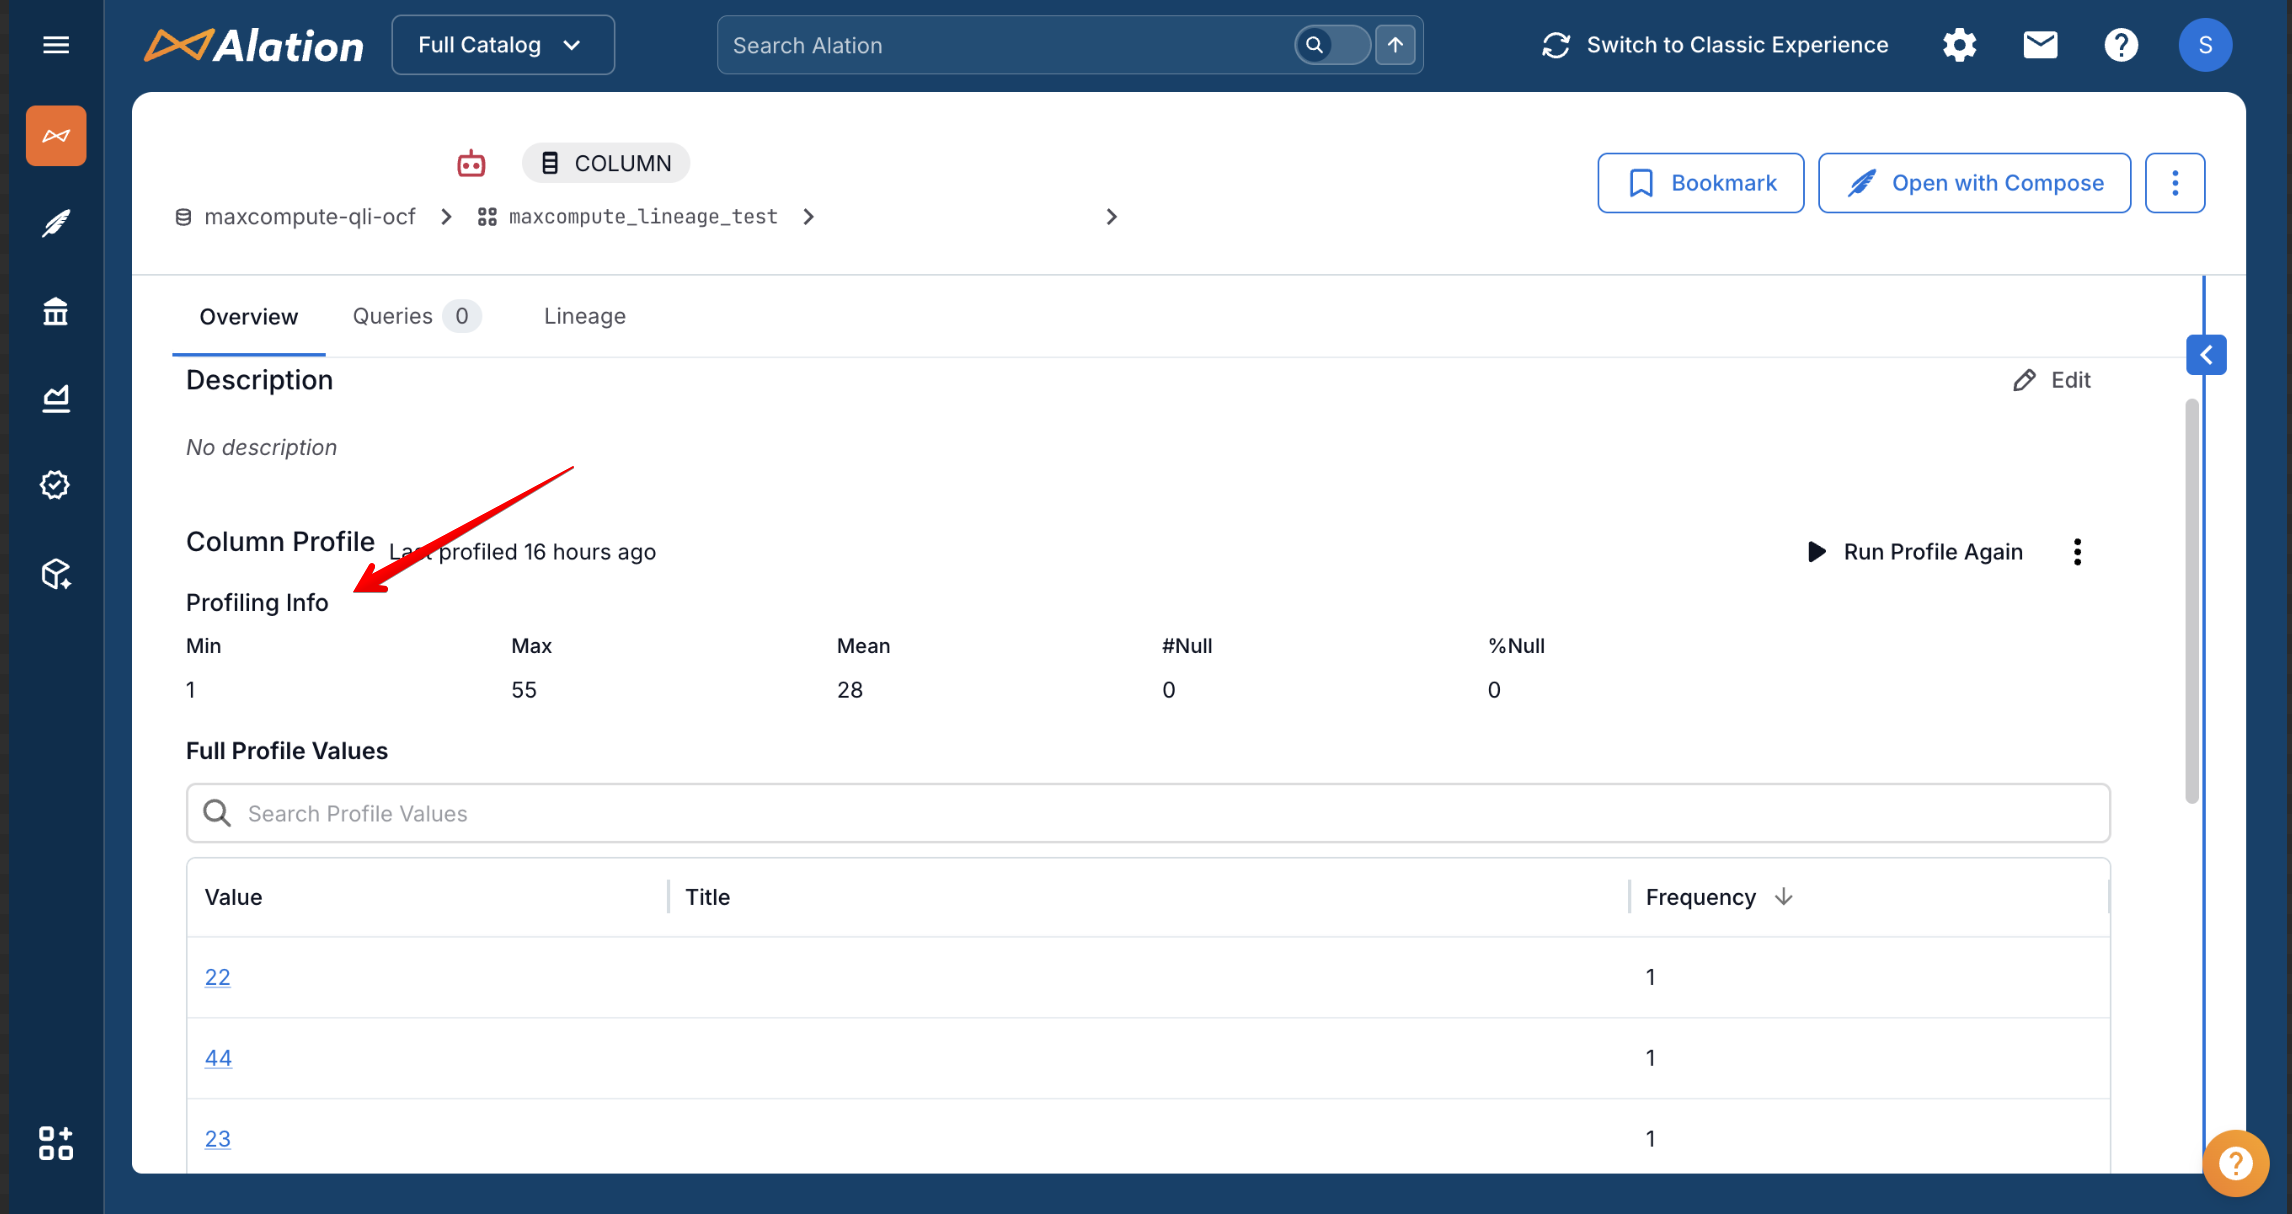
Profiling Metrics
Note
To view enhanced profiling metrics (Min, Max, Mean, Null Count, Null Percentage), the Profiling V2 feature flag must be enabled in Alation.
Alation Cloud Service (ACS): This flag is enabled by default. No action required.
Customer-Managed Alation: Enable the flag by running the following command from the Alation shell (requires backend access):
alation_conf alation.feature_flags.enable_profiling_v2 -s True
Restart Alation for the change to take effect.
If you do not have backend access, raise an SRE ticket to enable this flag.
The connector collects the following profiling metrics for each column:
For All Column Types:
Metric |
Description |
|---|---|
Row Count |
Total number of rows sampled for profiling. |
Value Distribution |
Top values and their counts (histogram). Shows the most frequent values in the column. For example, a STRING column might show “Active”: 500, “Inactive”: 200. |
Null Count |
Number of NULL values in the column. |
Null Percentage |
Percentage of NULL values in the column. |
Additional Metrics for Numerical Columns (INT, BIGINT, FLOAT, DOUBLE, DECIMAL):
Metric |
Description |
|---|---|
Min |
Minimum value in the column. |
Max |
Maximum value in the column. |
Mean |
Average (mean) value in the column. |
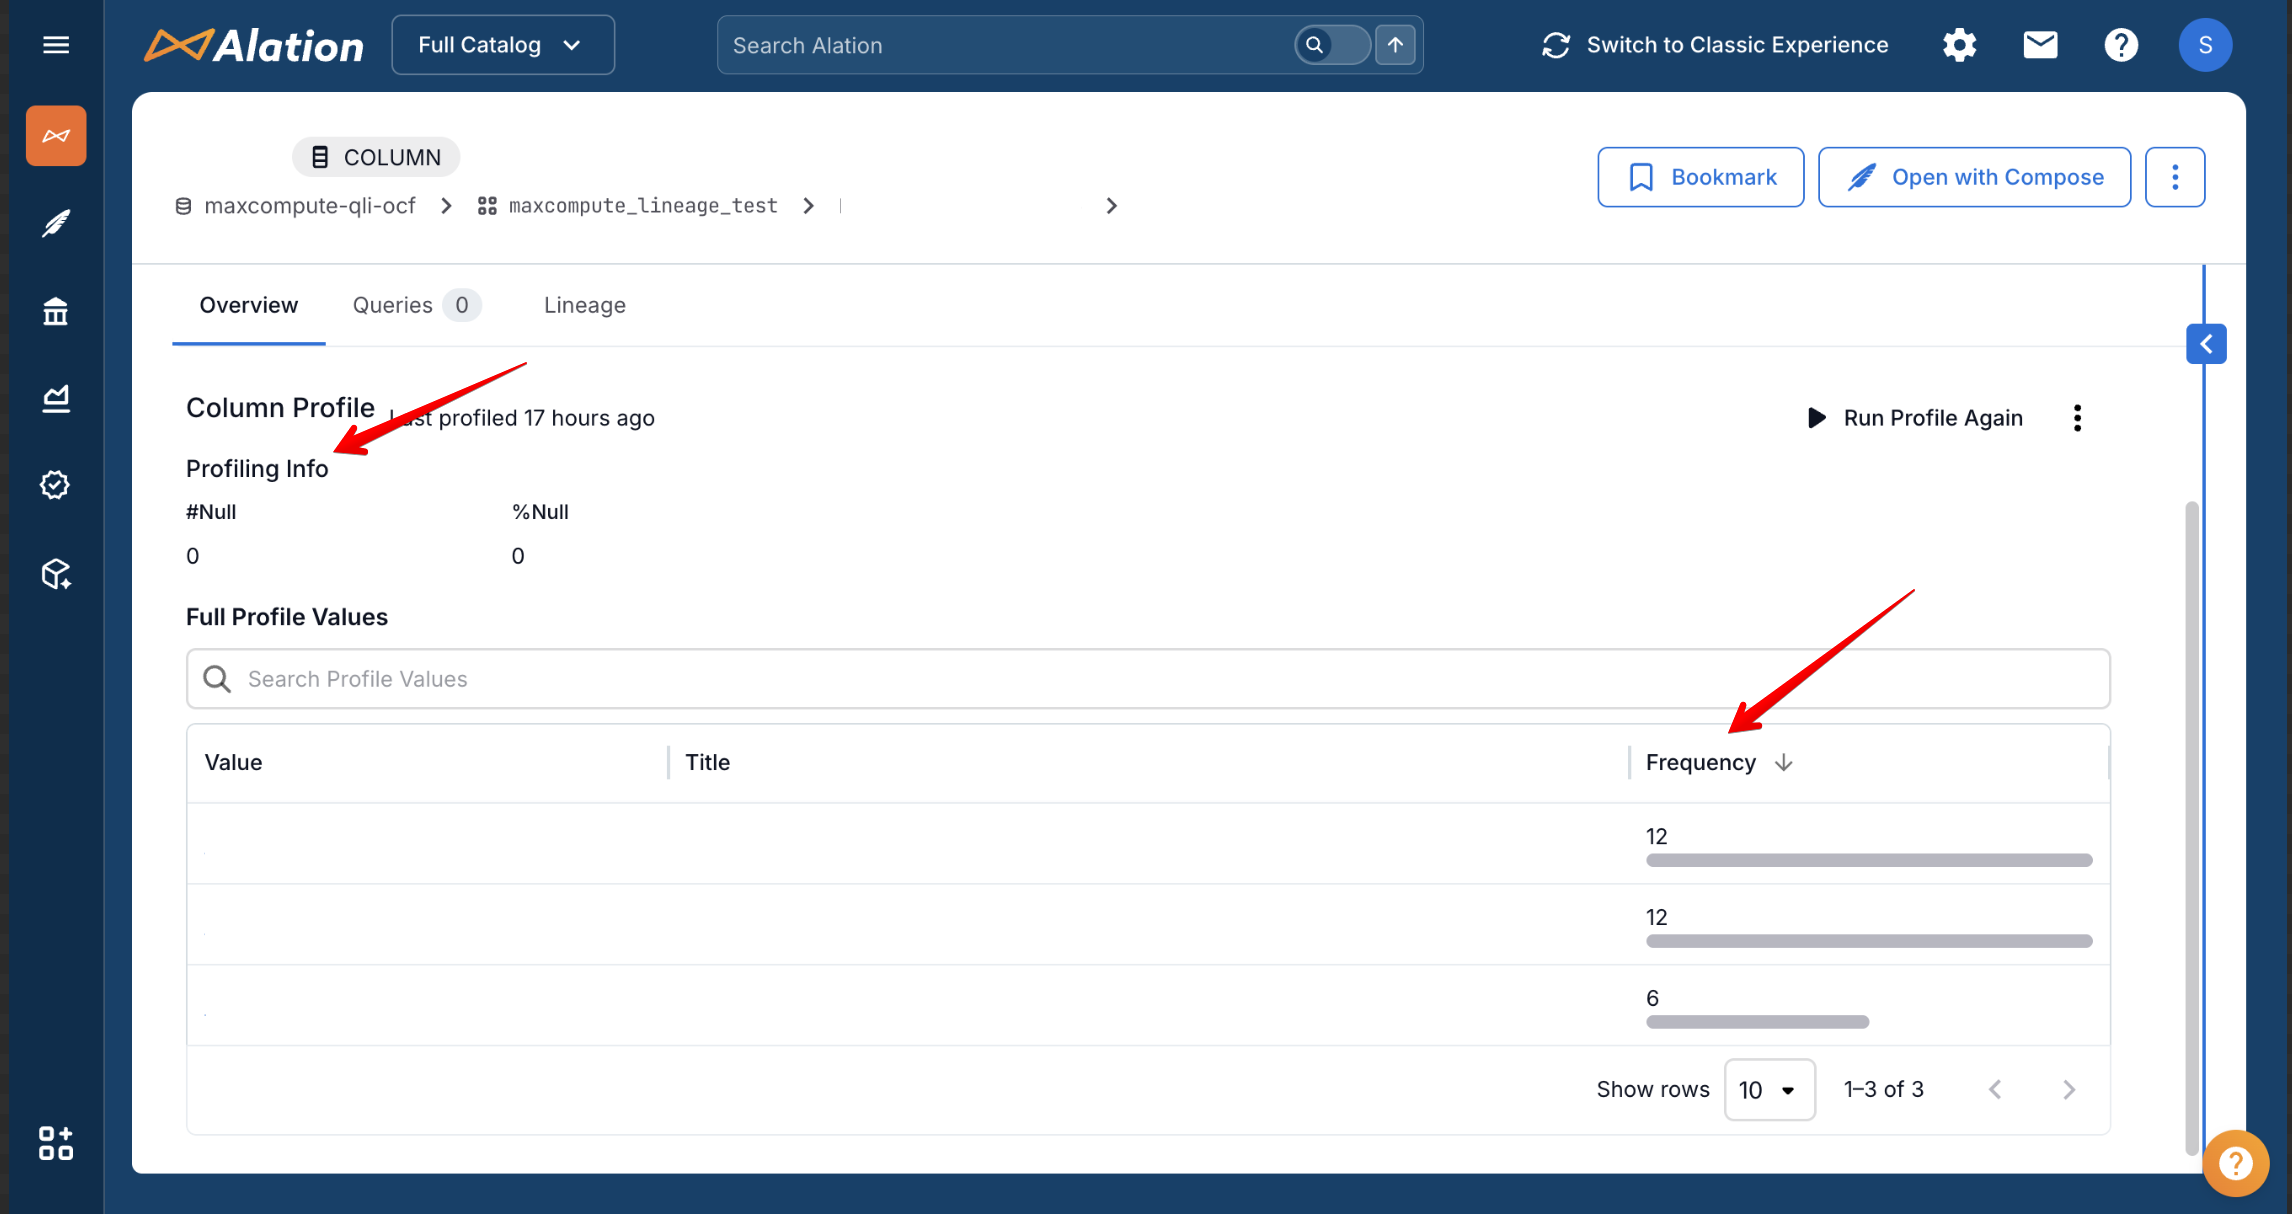
Example: Numerical Column Profiling
For numerical columns, the profile shows Min, Max, Mean, Null Count, Null Percentage, and Value Distribution:
Example: Non-Numerical Column Profiling
For non-numerical columns (STRING, DATE, etc.), the profile shows Null Count, Null Percentage, and Value Distribution:
Note
For partitioned tables, the connector queries INFORMATION_SCHEMA.PARTITIONS to find the most recently created partition per table. This requires the RAM user to have odps:Select on INFORMATION_SCHEMA.PARTITIONS in each MaxCompute project that contains partitioned tables. See the odps:Select entry in Prerequisites for the exact grant.
If the RAM user does not have this permission, sampling and profiling for partitioned tables will fail with ODPS-0130013: Authorization exception, followed by the ODPS-0130071 full-scan error as the fallback sample query runs without a partition predicate. Grant the permission and retry.
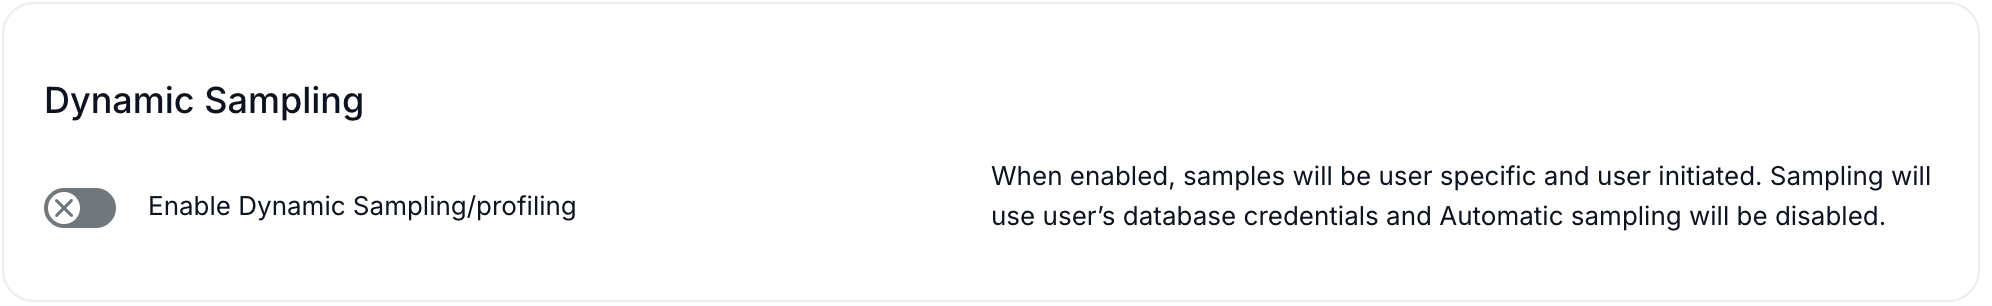
Dynamic Sampling (Per-User Profiling) (Beta)
Available from MaxCompute OCF Connector version 1.0.8.
The MaxCompute connector supports dynamic sampling, which allows profiling and sampling queries to run using individual user credentials instead of the service account. The profiling results are scoped to the user’s permissions: they can only profile tables they have access to.
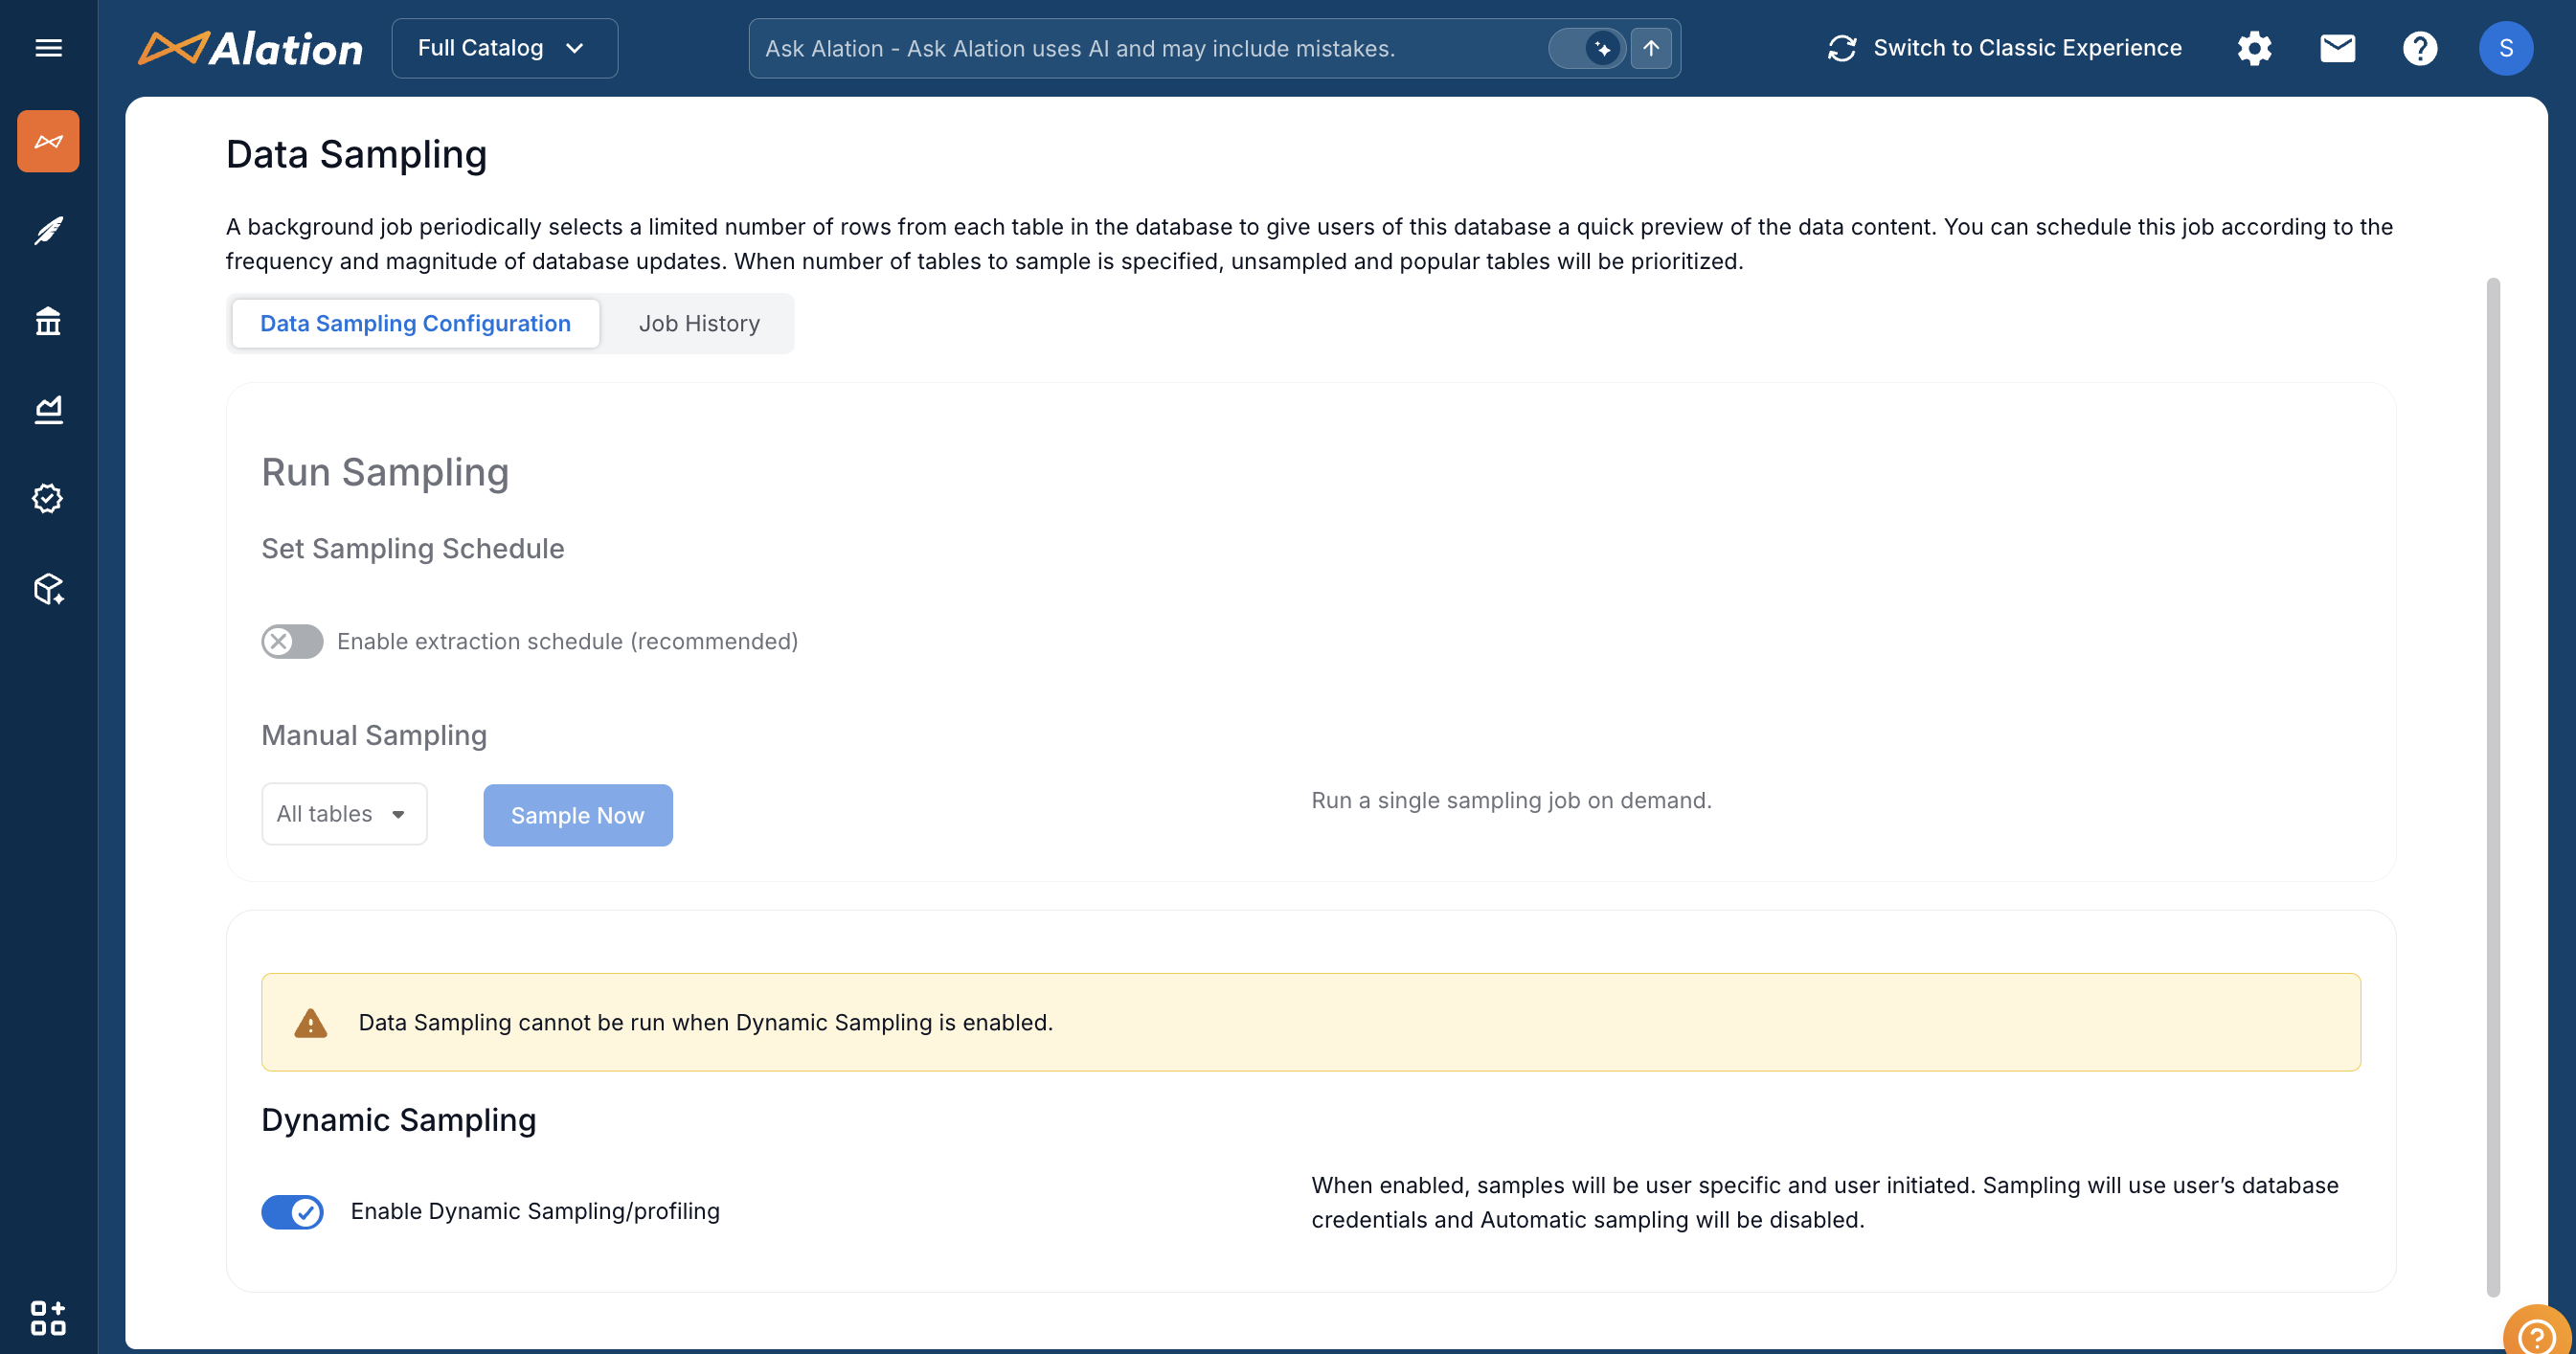
When Dynamic Sampling is disabled, sampling uses the service account credentials configured in General Settings. The connector automatically connects to the correct project for each table, so no extra setup is needed. Dynamic sampling is disabled by default.
When Dynamic Sampling is enabled, sampling uses a user-selected connection from the Choose a Connection option on the table page. Users can either use an existing saved connection or click + Add New to create one.
If Compose is enabled, users can use a saved connection from the Compose tab. In that connection, users should provide:
Username: Access Key ID
Password: Access Key Secret
If Compose is not enabled, users can still click + Add New from the Choose a Connection option on the table page and add a JDBC connection in this format:
odps:http://service.<region>.maxcompute.aliyun.com/api?project=<project_name>
Replace <region> with your Alibaba Cloud region (for example, us-east-1) and <project_name> with the target MaxCompute project. Users should provide their own credentials:
Username: Access Key ID
Password: Access Key Secret
Note
Dynamic sampling requires that the user has a configured connection with valid Access Key credentials. If the user has not configured credentials, sampling fails with an error. The connector does not fall back to the service account.
Custom Profiling (Beta)
Available from MaxCompute OCF Connector version 1.0.8.
Custom profiling allows users to provide their own SQL query for profiling a table. This is useful when you want to:
Profile only a subset of rows (for example,
SELECT * FROM my_table WHERE region = 'US' LIMIT 100)Profile computed or derived columns (for example,
SELECT price * quantity AS total FROM my_table)Profile joined or aggregated data
Custom Query-Based Sampling for Tables
As a Data Source Admin, you can specify custom queries for sampling individual tables:
On the data source Settings page, go to the Per-Object Parameters tab.
Navigate to the table level by selecting the schema (project) that contains the table you want.
Locate the table and click the edit icon in the Sampling Query column to open the query editor.
Add the custom query in the query editor and click Save. The next sampling job will use this query to sample the table.
Custom Query-Based Profiling for Columns
To specify custom queries for profiling individual columns:
On the Per-Object Parameters tab, navigate to the column you want to profile by selecting the table that contains it.
Locate the column and in the Profiling Query column, click the edit icon to open the query editor.
Provide a custom query and click Save. The next profiling job you run for this column will use the saved query to profile the column.
Note
Custom profiling queries are sanitized before execution (trailing semicolons removed). The query timeout and max rows settings from the profiling request are applied to the custom query.
There is no SQL validation for custom queries. Any errors will be logged in the Sampling Job Status table on the Data Sampling tab. Test-run custom queries in Compose before saving them to verify correctness.
Individual column profiling queries on the Per-Object Parameters tab take precedence over default profiling queries.
For more information about custom query-based sampling and profiling, see Configure Sampling and Profiling for OCF Data Sources.
Per-Project Connections
The MaxCompute connector uses per-project JDBC connections for profiling. When a table is profiled, a connection is created to that table’s specific project. This eliminates the need for cross-project permissions.
Limitations
Profiling large tables may take significant time and consume MaxCompute resources.
Profiling queries use full scan mode and may scan all partitions.
Complex data types (ARRAY, MAP, STRUCT) have limited profiling support:
Data Type
Supported Metrics
Not Supported
ARRAY
Null Count, Null Percentage, Row Count
Min, Max, Average, Histogram (value distribution)
MAP
Null Count, Null Percentage, Row Count
Min, Max, Average, Histogram (value distribution)
STRUCT
Null Count, Null Percentage, Row Count
Min, Max, Average, Histogram (value distribution)
Note
To profile data within complex types, consider flattening the data into separate columns using views with
EXPLODEorLATERAL VIEWstatements, then profile the view instead.
Troubleshooting
Profiling Failed
Ensure the RAM user has read permissions on the table.
Check MaxCompute quota and resource availability:
How to check:
Log in to the Alibaba Cloud MaxCompute Console.
Navigate to Management > Quota Management to view your project’s quota usage.
What to check:
Resource
Description
Compute Unit (CU) quota
Verify sufficient CUs are available. Profiling queries consume compute resources. If CU quota is exhausted, queries will be queued or fail.
Concurrent query limit
Check if the project has reached its maximum concurrent query limit (default: 100 per project).
Storage quota
Ensure the project has not exceeded its storage quota, which may affect query execution.
SQL job status
In the MaxCompute console, go to Job Management to check if profiling jobs are queued, running, or failed.
For more information on quotas and limits, see MaxCompute Quotas and Limits in the Alibaba Cloud documentation.
Slow Profiling
Reduce the sample size for large tables.
Profile tables during off-peak hours.
Consider profiling only critical tables.