Alation 2021.2: More Tools to Drive Data Culture with Monali Narayanaswami, Director of Product Management at Alation

By Talo Szem
Published on May 20, 2021

Hi Monali! Congratulations on launching the 2021.2 update. We have lots to cover, so let’s dive in. I know you worked on important new updates in Alation Analytics. Can you tell us more about what Alation Analytics is and it’s connection to data culture?
In 2020.3 last year, we set a goal to make Alation Analytics better serve our customers. We’re seeing customers use Alation Analytics for a variety of use cases. These include catalog adoption, governance, curation, and asset tracking. We wanted to support these use cases and more.
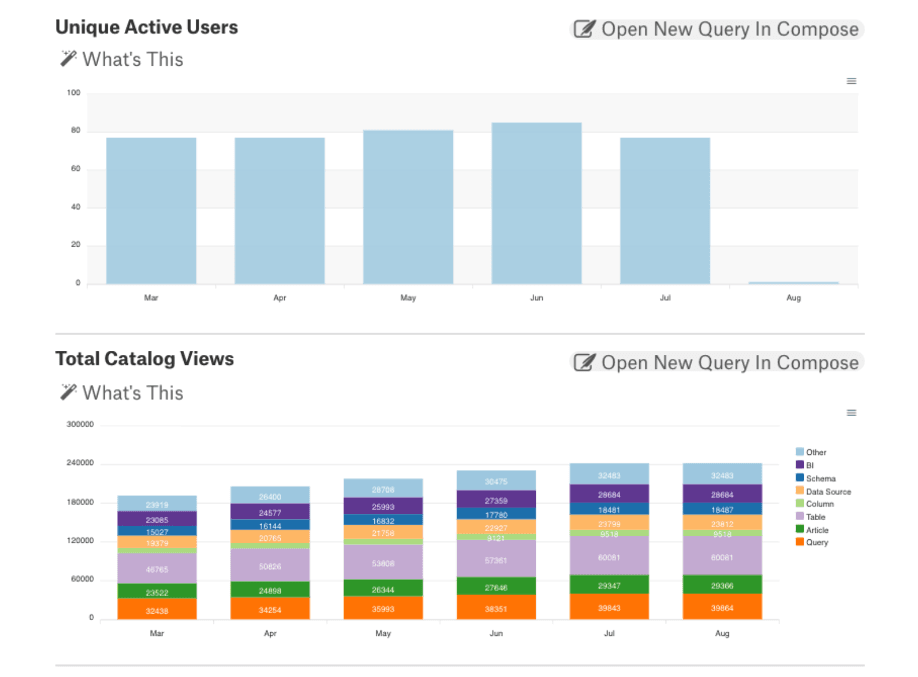
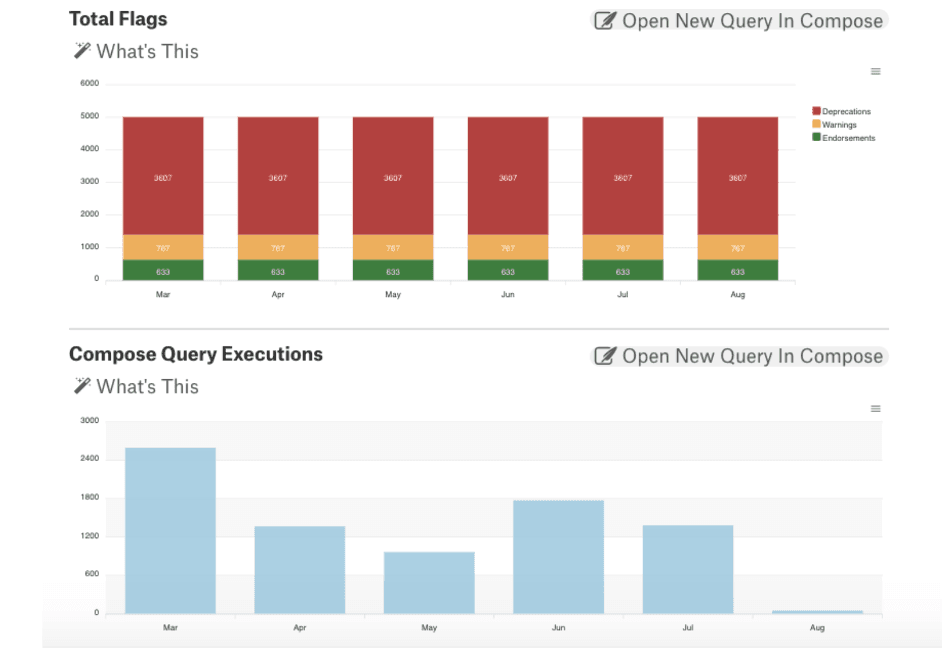
With Alation Analytics, we’re giving you tools to monitor catalog adoption and health. Out-of-the-box visualizations help data leaders understand adoption progress and activity. You can see usage trends, who is most active, new content being created, and which assets are the most utilized
Why is this important?
Well, the more people who use the catalog, the better it gets. And the better it gets, the more people use the catalog. We call that the “virtuous cycle.” Leaders are striving to engage as many users as possible. These new charts enable those leaders to track catalog progress and usage across teams and departments. They can see who is most engaged, and who might need a nudge.
Why is it useful to see who is the most engaged with the catalog?
Two major reasons. First, in a vast data landscape, it’s useful to find the experts. CDOs want to know, Who are the people that know the most about the data we have? Those are your subject-matter experts. If they’re supported, and their knowledge shared, they can raise the data literacy level of the entire enterprise.
Second, visibility into the assets people engage with most is valuable. These popular assets orient newcomers quickly and accelerate onboarding. We’re finding that this popularity data helps all users discover what is most useful, and potential areas for expansion.
Sounds like onboarding just got much easier! How else does 2021.2 welcome more people to the catalog?
With the release of AA, we’ve simplified our data schema, so that people can more easily ask complex business questions. Basically, we’re lowering the barrier for entry. Even people with less experience writing queries can query this schema and answer questions about their data with speed and ease.
I understand deployment also got an upgrade. What can you tell me about that?
The second feature powers separate deployment. Now, customers can deploy AA separately from the core Alation Data Catalog. This is useful! It gives both the catalog and AA more resources and flexibility. This in turn powers better performance. We use a modern containerized architecture to deploy, which increases reliability through process isolation.
Sounds like your team has been hard at work. What other new updates are you excited to share? How does AA advance analytics?
Four more features come to mind.
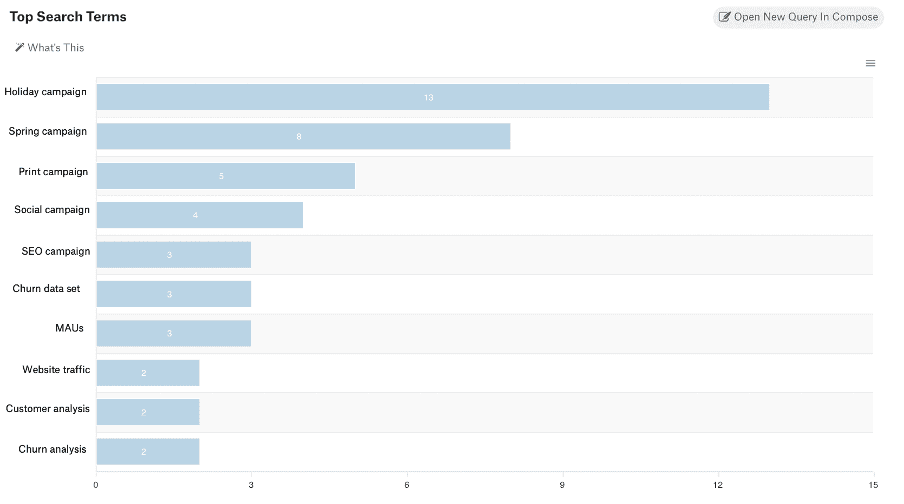
We’ve added a “Top Search Terms” visualization. This means you can see what your catalog users are searching for from day one. This visualization lives in the Alation Analytics Dashboard and keeps admins informed about what people are searching.
With the new groups filter, you can filter all Alation Analytics visualizations by group. This lets you drill down into activity patterns by particular groups of interest. So you can compare how people use data in finance versus, say, marketing.
Now, it’s easier to analyze file system data. You can get insights into user behavior around this type of data. Plus, three new tables let you analyze file systems by data sources, directories, and files.
Lastly, third-party visualizations are an update I especially like. Now, you can see all your favorite visualizations in a single place, the Alation Analytics Dashboard. We make it easy to embed your most useful visualizations from third-party tools like Tableau.
Who stands to benefit most from these new advances?
All catalog users will benefit, but more specifically I can think of two groups.
Data champions, looking to drive a data culture in their organizations, will love these updates. We’re giving our champions tools to find the experts who can help advance data literacy and culture. With this update, they can monitor onboarding and adoption health and activity.
Second, governance professionals looking to drive greater compliance with internal and external policy requirements will like these updates. These folks now have tools to monitor catalog usage and ensure compliance.
And this comes on the heels of Alation being named a winner for the Best Data Governance Solution by IMD/IRD! But setting governance aside for now — how will all Alation users benefit?
All users can benefit from what their colleagues know. Those curious to learn from their coworkers can explore Alation to find which tables or queries are the most popular. Seeing what’s popular is a huge advantage! This guides smart use of Alation. It also helps drive discovery and reduces time users might otherwise spend searching.
Monali, you’ve worked with both catalog users and admins. You’ve listened to what people want, and helped make those requests a reality. Did anything surprise or delight you on this journey?
One of the best parts about building Alation Analytics is hearing about all of the use cases and ways that our customers are building on top of Alation Analytics. Our customers are using the data in Alation Analytics to support governance, curation, catalog adoption efforts and more.
For example, it’s been exciting to see customers set OKRs around their data catalog efforts. By setting metrics-driven goals, AKA “Objectives and Key Results” leaders can drive greater usage, time savings, and collaboration through Alation. We’re seeing that people are even building OKR reports! These help their organizations track individual and group progress toward OKRs! This, to me, shows the real impact of the data catalog on achieving both business and individual goals.
Tagged with
Loading...