

At Alation, we’re building AI agents that pair large language models (LLMs) with structured data—a powerful combination, but one with strict requirements for correctness. Unlike freeform tasks like summarization or search, structured query agents – that take natural language tasks or questions and generate executable SQL queries – must return precise, reliable answers. This creates a unique challenge: as the landscape of available LLMs evolves rapidly, we’re constantly upgrading our models, prompts, and architecture to improve our structured Query Agent’s performance—but how do we ensure that these changes actually lead to better outcomes?
In this post, we share how we built an evaluation framework that keeps pace with our evolving Query Agent. As we update prompts, test new models, and expand datasets, we found that traditional metrics like Execution Accuracy couldn’t capture meaningful improvements. We walk through the evolution of our evaluation strategy: from brittle exact matches, to heuristics, to a hybrid system including an LLM grader. Along the way, we highlight the lessons we learned and how a smarter, human-aligned scoring system helped us restore trust in our metrics and move faster.
When AI metrics fail to capture user sentiment
We’ve been building AI agents at Alation since before “agents” were even a thing. As we expanded the capabilities of our Query Agent, we found some surprising results.
After rebuilding the core of our system, users raved about the improved experience and quality: they praised the agent’s ability to explore the data to find the proverbial “needle in a haystack” while also knowing when to ask for clarification, and even more importantly, when to say the data didn’t exist to answer the question. Despite these qualitative improvements, the evaluation metrics we relied on to measure progress barely moved. The standard academic metrics we had trusted for years, such as Query Exact Match and Execution Accuracy used on the popular Spider Benchmark, were blind to the improvement.
So we dug in. What we found was a mismatch between what our benchmarks penalized and what users actually cared about. Minor formatting differences or extra SQL columns—these harmless quirks– were being marked as failures, while genuine improvements, such as incorporating exploratory queries to get precise filter values for a task, were going unrecognized. Manual reviews gave far more accurate evaluation scores, but human-in-the-loop eval is far too slow and painful to support an agile development loop.
We realized we needed an evaluator that truly thought like our expert reviewers—or better yet, our real users. This led us to adopt the LLM‑as‑a‑Judge paradigm (first formalized in mid‑2023), in which a strong large language model (such as GPT‑4) serves as an automated evaluator. Meaning: instead of relying on brittle rule‑based metrics, the model is given an output (e.g. a generated SQL response) along with judging criteria, and asked to score or compare it in a human‑like way—just as a reviewer would. Research shows that these LLM judges can reach over 80% agreement with human evaluators, matching human‑level consistency, while being far more scalable and explainable than manual reviews.
With that foundation, we built a hybrid evaluator—combining classic benchmark signals with an LLM judge trained and prompted to evaluate structured‑data tasks like SQL query responses through a human lens. The result: faster, smarter scoring that aligns with human judgment of meaningful improvements, letting us iterate confidently and reflect actual customer experience.
Creating a metric for the Query Agent
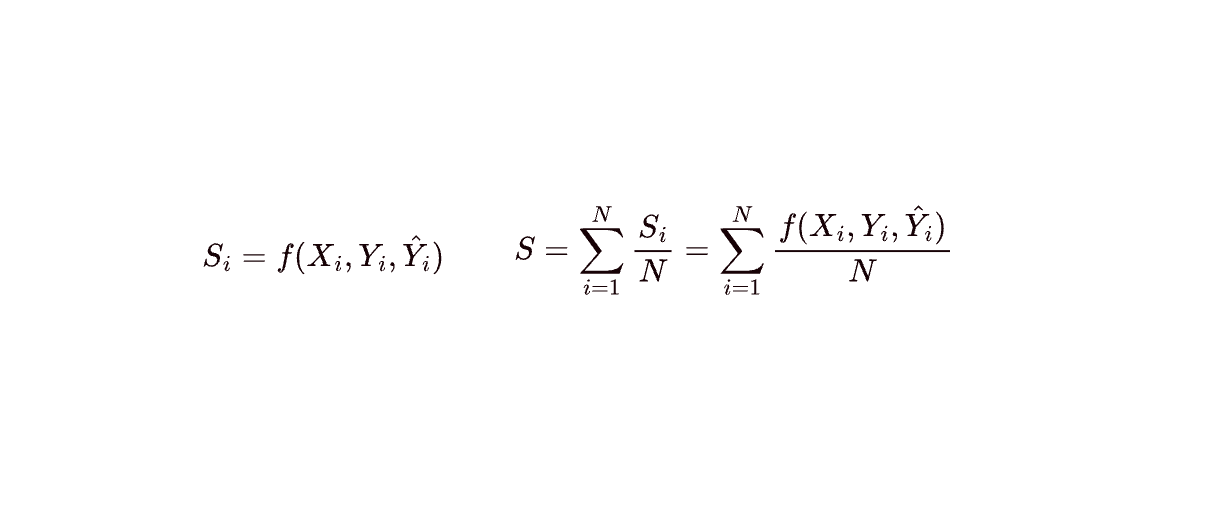
Let’s focus on the star of our system: our Query Agent. It’s a powerful agent, but it operates on simple text inputs and returns text along with a few supporting tables. When evaluating the Query agent, the question we’re trying to generate a numerical metric for is, Given a set of Tables and relevant Columns, can it return the information required to answer that question? To do this, we’ll need a set of questions and reference queries. In traditional Machine Learning, you can think about this as your ground truth to which you’ll compare a predicted result. We define a score for example i as Si, and the total score for an evaluation set as S, the average score across all examples:
The table below shows examples of what Xi, Yi,, and Y^_i look like:
X_i | Question: How many tickets were sold for the 2025 Super Bowl.
Table Metadata: Columns: … Metrics: … |
Y_i | SQL: SELECT COUNT(tickets) FROM sales WHERE year = 2025
Result: 65,719 |
Y^_i | SQL: SELECT year, COUNT(tickets) FROM sales WHERE year = 2025
Result: 2025 65,719 |
This function will accept the question we asked, the reference and predicted table result, along with the relevant table metadata, and return a score between 0 and 1, which we’ll use to aggregate our results across examples.
Version 1: Execution Accuracy
The simplest (and most natural) approach for creating this function is to say that the reference and predicted table results must match each other exactly, which is known as Execution Accuracy. This is a sensible starting point, since it guarantees that each question returns identical information when producing a score of 1; otherwise, the score will be 0. While some may critique this method as being overly simplistic and allowing for false positives, the risk is quite low, and it works well in practice. A similar, but stricter approach is to check whether the SQL queries themselves match exactly, not just their results. Since there is variability in LLM-generated responses, we found it too strict to be useful.
Execution Accuracy can actually take us quite far, but let’s look at the drawbacks. Consider the following question, reference table, and 2 hypothetical predicted tables.
Question: How many tickets were sold for the 2025 Super Bowl?
Y
Number of Tickets Sold |
65,719 |
Y^_i
Year | Tickets Sold Count |
25 | 65,719 |
Y^_j
Date | Seats Sold | Seats Available |
2025 | 65,719 | 74,295 |
Using execution accuracy, even though these contain the same information, none of these tables would return a score of 1 when compared to each other! While this may not seem like a big problem, recall that user inputs can be highly variable – “Super Bowl tickets 25”, “tickets sold 2025”, “number of seats Super Bowl LIX”. These all ask for the same information, but do so differently, so we expect both the user input and the predicted output to include small variations. While the content formatting may differ for column names or even numeric or text formatting, the formulations and content should remain the same.
Version 2: Execution accuracy with heuristic variants
These observations illustrate that a metric should not only ensure the results are the same, but should not be overly strict while doing so; otherwise, the metric loses credibility. To account for reasonable variations that communicated the same result, we included a few heuristics in our function. Here are some examples (by no means an exhaustive list) we can use to simplify the constraints on execution accuracy:
Column name and order don’t matter: Permute columns that don’t have a name match between the reference and prediction
Redundant or extra columns don’t matter in the prediction: Including extra or related information, such as additional metrics, should not penalize our scoring function
Obvious columns don’t matter for the reference: for the above example, including the date column on which we filtered is helpful for visibility, but shouldn’t be required. Table Y and Y^_A convey the same information in the context of the question.
For the example above, the above heuristics are capable enough to mark the tables as equivalent. Creating targeted heuristics that solve the particular problems brought on by a metric is an effective, deterministic way of measuring accuracy, and should be the next step before considering an LLM-based metric.
However, after months of using these heuristics, we found that we were still spending hours of time digging through examples, finding instances where small variants, such as adding an extra column that broke down aggregations, formatting date columns differently, or even interpreting an ambiguous date differently between iterations, were adding noise to our accuracy results. We bucketed these examples to find patterns and discovered that trivial stylistic differences and harmless extra information were among the leading reasons the prediction was wrong. These are examples of “false negatives” coming from our metric. Indeed, when reviewing examples from a major change where we added advanced reasoning (see results below), we found a large number of false negatives, meaning our metric met its expressive limit. There must be a better way.
Inspired by our manual review process, we decided to create an LLM-based evaluator to help us out.
Version 3: LLM-as-a-Judge (How to evaluate an AI agent’s SQL queries accurately)
Because our metric could not distinguish between two implementations that significantly differed qualitatively, we decided to turn to an LLM to automate the process of a human reviewing the examples that fail to match using our deterministic metric. We chose this approach because it included the benefits of execution accuracy and heuristic-based approaches, while addressing their shortcomings with a final equivalence check.
The most important aspect of an LLM evaluator is that it must align with human judgment. Trusting an evaluator without first testing it is a recipe for disaster. To align the LLM with our judgments, we assembled a number of representative examples from our benchmarks and were sure to include both positive and negative matches. We included information like the original user question, the retrieved metadata, and the reference and predicted SQL and result tables. These are the artifacts that human graders use to determine if an example was correctly answered, so we mimicked the process for our LLM grader.
Finally, we codified a set of principles for judging whether a predicted result was equivalent to a reference for a given question. Some sample principles include:
“If the reference and prediction contain the same information, but are formatted differently, such as using different date syntax or pivoting the table, mark the prediction as correct.”
“If the prediction omits any important filters present in the reference, mark the prediction as incorrect.”
“If the prediction includes a harmless dimension to the result, which breaks down an aggregation, but it still addresses the question, mark it as correct.”
Here are some examples of matches we expect from our LLM evaluator:
Question: What is the total cost broken down by month this year in Q1?
Reference:
Quarter | Month | Cost |
1 | 2025-01 | $1000 |
1 | 2025-02 | $2000 |
1 | 2025-03 | $3000 |
Prediction:
Month | Cost |
January | $1000 |
February | $2000 |
March | $3000 |
Match: Yes
Reason: These convey the same information, but format the month column differently. The prediction excludes the Quarter column, but includes it in a filter, so the month results are the same.
Question: Total sales in APAC countries
Reference:
Total Sales |
$1,234,567.89 |
Prediction:
Country Name | Total Sales |
China | $53,279.12 |
Japan | $101,300.97 |
South Korea | $12,592.64 |
Indonesia | $42,309.01 |
… | … |
Match: Yes
Reason: The SQL used to tabulate the total sales for the reference is identical to the prediction, although the prediction breaks down the total sales by country, which is a reasonable interpretation of the question. Since this answers the question, and a user can easily ask to find the total amount across the countries, this prediction is correct.
To ensure our LLM evaluator is aligned with a human grader, we curated an evaluation set for it. When we make changes to the evaluator, we test all changes against that benchmark, so we only increase human-LLM agreement over time. Importantly, since this evaluator only looks at examples that fail execution accuracy, we paid close attention to the examples the LLM marks as correct, and made our false positive rate as low as possible.
After carefully creating this LLM evaluator and tuning it to align with our judgment, we returned to our experiments to test if the improved architecture would show improvements using our new evaluator. We collected our hardest questions across our customer base – including examples that required multiple queries to solve – to measure how well our agents could respond to our evolving data tasks.
The results? Our human-aligned LLM evaluator reflected the sizable improvement we made to our query agent. While traditional evaluators were helpful, up to a point, they could not measure acceptable variations in a predicted query, which hindered our ability to make progress.
Evaluation is critical to the success of any application, particularly those that use machine learning. We believe that the best evaluators combine the strengths and mitigate the weaknesses of both deterministic and adaptive scorers. By using an LLM-based evaluator, we’ve made our team more efficient and restored trust in the metrics we use to determine the quality of our product. Further, we’re already considering other areas where we can use an LLM evaluator to track the quality of the features we ship to our customers.
Curious to learn more? Book a demo with us today.
- When AI metrics fail to capture user sentiment
- Creating a metric for the Query Agent
Contents
Tagged with
Loading...