
Data quality—or the lack thereof—is directly linked to your organization’s bottom line. To illustrate, in one Forrester survey, more than a quarter of the respondents admitted to losing over $5 million annually as a result of low data quality. Some even lost more than five times that already staggering figure for the same reason.
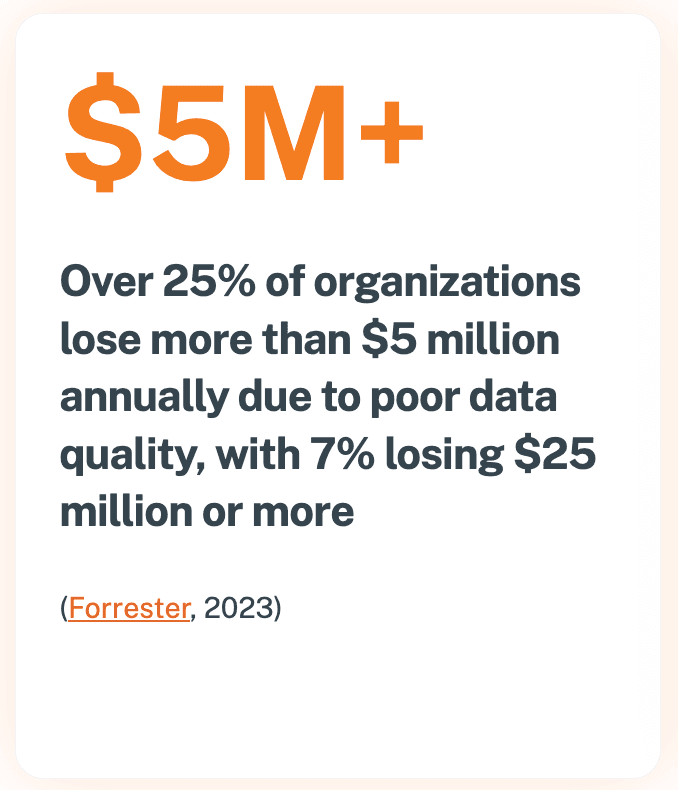
(Source)
Data is the cornerstone of both operational decision-making and long-term innovation. Incomplete or inaccurate data leads to misinformed strategies and erodes trust among data consumers. Without reliable data guiding future planning, it becomes increasingly difficult to stay competitive. Conversely, high-quality data empowers leaders to make confident decisions and can also reveal opportunities for cost reduction or new revenue streams. When you use this data properly, it can translate into measurable gains worth millions of dollars.
To achieve that outcome, though, you must first have a reliable way of measuring data quality. This is where data quality dimensions come in. Here, you’ll learn not only what they are but how they’re measured, how you can improve them, and how you can monitor data quality at scale.

Key takeaways
Data quality dimensions are categories that describe what “quality” data is. Common dimensions include accuracy, completeness, timeliness, consistency, and integrity.
Maintaining data quality is important not just for enabling everyday business decisions, but also for training and deploying AI models as more enterprises embark on artificial intelligence projects.
Data quality metrics are the specific figures that enable you to track progress within different data quality dimensions.
In addition to determining key metrics to track, you need a strong governance framework to ensure data is maintained consistently according to your standards.
Clear quality threshold service-level agreements (SLAs) are valuable for tracking data quality improvements, as are tools for automating monitoring.
What are data quality dimensions?
Data quality dimensions are the fundamental categories that define what “quality” means for data. They include aspects such as accuracy, completeness, timeliness, consistency, validity, and relevance. By framing quality in these dimensions, organizations gain a shared language for evaluating whether data is trustworthy and fit for purpose.
Robust use of dimensions provides more than an abstract definition of “good” data—it creates the foundation for data governance frameworks and standards. When applied consistently, these dimensions drive tangible business results:
Continuous monitoring: Dimensions like timeliness and consistency guide real-time oversight, helping teams detect anomalies before they spread into analytics and operations.
Targeted remediation: By clarifying dimensions such as accuracy and integrity, businesses know where to focus improvements and prevent recurring issues.
Organizational alignment: Dimensions give both technical teams and business leaders a clear set of criteria for what quality means in each use case, reducing miscommunication and building trust.
Ultimately, strong data quality dimensions turn the idea of “trusted data” into a structured, repeatable practice. They safeguard reporting accuracy and give organizations the confidence to scale analytics and AI without fear of data-driven missteps.
The 9 most common data quality dimensions that organizations track
High-quality data is a must for making informed decisions. To get there, companies need to measure and monitor key data dimensions. Here are nine dimensions leaders should focus on:
1. Completeness
Data completeness focuses on ensuring that all required data fields are filled in, which provides a full view of operations or customer interactions. When information is missing, it can distort reports or affect models, so complete data is key for making informed decisions.
2. Accuracy
Data accuracy assesses whether data correctly reflects the real-world entities or events it represents. Only accurate data can be trusted and relied upon for critical tasks and reporting, which is why it’s so critical to apply data cleansing, data profiling, and other techniques to prevent errors from propagating.
3. Consistency
Data consistency ensures data is uniform across different sources, systems, and periods. While consistent data doesn’t automatically guarantee correctness, it makes errors easier to identify and resolve. It also ensures information and processes are predictable and reliable, reducing the risk of issues or confusion.
4. Integrity
Data integrity verifies that relationships between datasets are correct within the system—it encompasses data security and protection from unauthorized access or corruption. Strong data integrity prevents errors from propagating across systems and ensures data remains unchanged during any transfer or reformatting.
5. Timeliness
Timeliness evaluates whether data is current and available when needed. Outdated information can cause missed opportunities or poor decisions. For example, marketing campaigns using old email addresses may fail to reach recipients. Ensuring your data is fresh allows you to make decisions and progress based on the latest information.
6. Validity
Validity measures whether a value conforms to a preset standard: correct data formats, no duplicate records, correct data types, and data values that conform to business rules. It helps to prevent invalid entries that can disrupt reporting or calculations.
7. Relevance
Relevance refers to data that is applicable and meaningful for the intended purpose. For instance, marketing teams need customer data, while executives focus on performance metrics. Making relevant data readily available improves efficiency because the data is fit for purpose. Plus, the user has the appropriate context to act on it (without information overload).
8. Usability
Usability assesses how easily data can be accessed and applied. Even high-quality data becomes ineffective if it is difficult to use. For instance, analysts often struggle with CSV dumps that have missing headers or tables without descriptions, and post-migration data with no metadata can create similar challenges.
9. Uniqueness
Uniqueness measures whether each record in a dataset is distinct and free from unnecessary duplication that could distort analyses, inflate counts, or create conflicting information. Take, for example, duplicate records in a CRM. This could result in sales teams contacting the same person multiple times, skewing revenue forecasts and damaging the customer experience. By enforcing uniqueness, organizations maintain individual, trusted records.
Why AI readiness requires granular data quality tracking
In addition to benefits like accurate reporting and clean, easy-to-use data, data quality is critical for AI and machine learning (ML) use cases as well. AI-ready data is fit for training and deploying models, not just “high quality.” This is because AI requires representative data, including outliers that traditional cleansing might remove.
To assess whether data is fit for purpose, teams can use data quality as a lens. For example, tracking dimensions such as completeness, accuracy, bias, and data consistency helps identify gaps and ensures AI relies on reliable, explainable data.
Organizations also need granular, metadata-rich tracking that gives a detailed view of data quality in context. This includes assessing relevance, lineage, and domain-specific accuracy, which allows stakeholders to evaluate whether data is fit for AI applications. Without this level of detail, datasets may appear “clean” at a high level but fail to deliver trust or explainability in production models.
In practice, enterprises should monitor attributes such as data freshness, sampling bias, consistency across sources, and changes over time. Tracking these metrics helps detect drift, anomalies, or gaps that could impact model performance. As a result, you can ensure your AI workflows rely on accurate, representative, and trustworthy data.
What data quality metrics should you track?
Without specific numbers tied to them, it’s hard to evaluate how your organization is currently performing across data quality dimensions like completeness, timeliness, and relevance. Hence, it’s important to know what dimensions are important and identify the specific data quality metrics that map to them.
For each dimension, you’ll want to set benchmarks for both high- and low-quality indicators, like the following, to get a full picture of data health:
Ratio of data entries to errors
Number of empty or incomplete values
Number of data conversion errors
Example error rate for nulls
Quantity of “dark” or unusable data
Email bounce rates from outdated or incorrect addresses
The time teams spend extracting actionable insights from data
Cost of storing data versus the value it provides
Once you determine which data quality metrics you’ll need to track long-term, what comes next? Implementing plans to improve performance across the different dimensions.
How can you influence data quality dimensions?
Improving and maintaining data quality requires a structured approach from the start. Planning ahead prevents issues from slipping through the cracks. Teams that define clear roles, set measurable standards, and build quality checks into daily workflows can catch problems early and consistently.
To put this into practice, organizations should take three concrete steps to:
1. Implement a data quality metrics and data governance framework
A strong data quality program starts with defining key metrics that relate to dimensions such as accuracy, completeness, and timeliness. These metrics guide a data governance framework that clarifies who uses the data, how it’s managed, and who is accountable. Embedding these standards into workflows ensures that quality checks happen naturally as part of day-to-day operations.
Assigning responsibilities to data stewards, documenting workflows, and setting clear rules for exceptions reinforces accountability and makes quality everyone’s job. Keep the framework simple and review it regularly to keep pace with changing business needs.

2. Establish feedback loops with data owners
Structured feedback loops between data stewards and business units help catch quality issues quickly. For example, if an anomaly appears in sales data, data owners can clarify whether it reflects a real business change or an error. Regular check-ins and easy reporting channels make it simple for teams to flag issues or suggest improvements. This approach keeps everyone accountable and strengthens cross-department collaboration, making data quality part of normal operations.
3. Ensure key performance indicators (KPIs) alignment and scorecard integration
Link data quality metrics to KPIs and integrate them into existing dashboards to show how clean data impacts decision-making and business outcomes. For organizations with lower governance maturity, tracking quality as KPIs helps identify and reduce errors or delays. Embedding these metrics into daily processes ensures teams act on issues consistently, and over time, connecting quality to business goals reinforces continuous improvement.
How can you monitor data quality at scale?
Monitoring data quality across large enterprises relies on clear standards and the right tools. With standards in place, teams can catch small errors before they turn into larger problems. With modern tools that support automation, it’s easier to scale operations up while staying confident that the data driving decisions is accurate. How can you implement both?
Define quality threshold and SLAs
Quality thresholds establish acceptable levels of accuracy, completeness, timeliness, and other dimensions for key data types. Service-level agreements (SLAs) must also clarify how to modify these standards, who should review them, and their cadence.
This will give your team a clear framework for evaluating data performance and boosting the quality of data to better support business goals.
Over time, though, you’ll need to update thresholds and SLAs as business needs change. This will keep data quality in line with organizational objectives and support accurate decision-making. By actively maintaining these standards, teams can prevent errors from spreading and reduce costly rework.
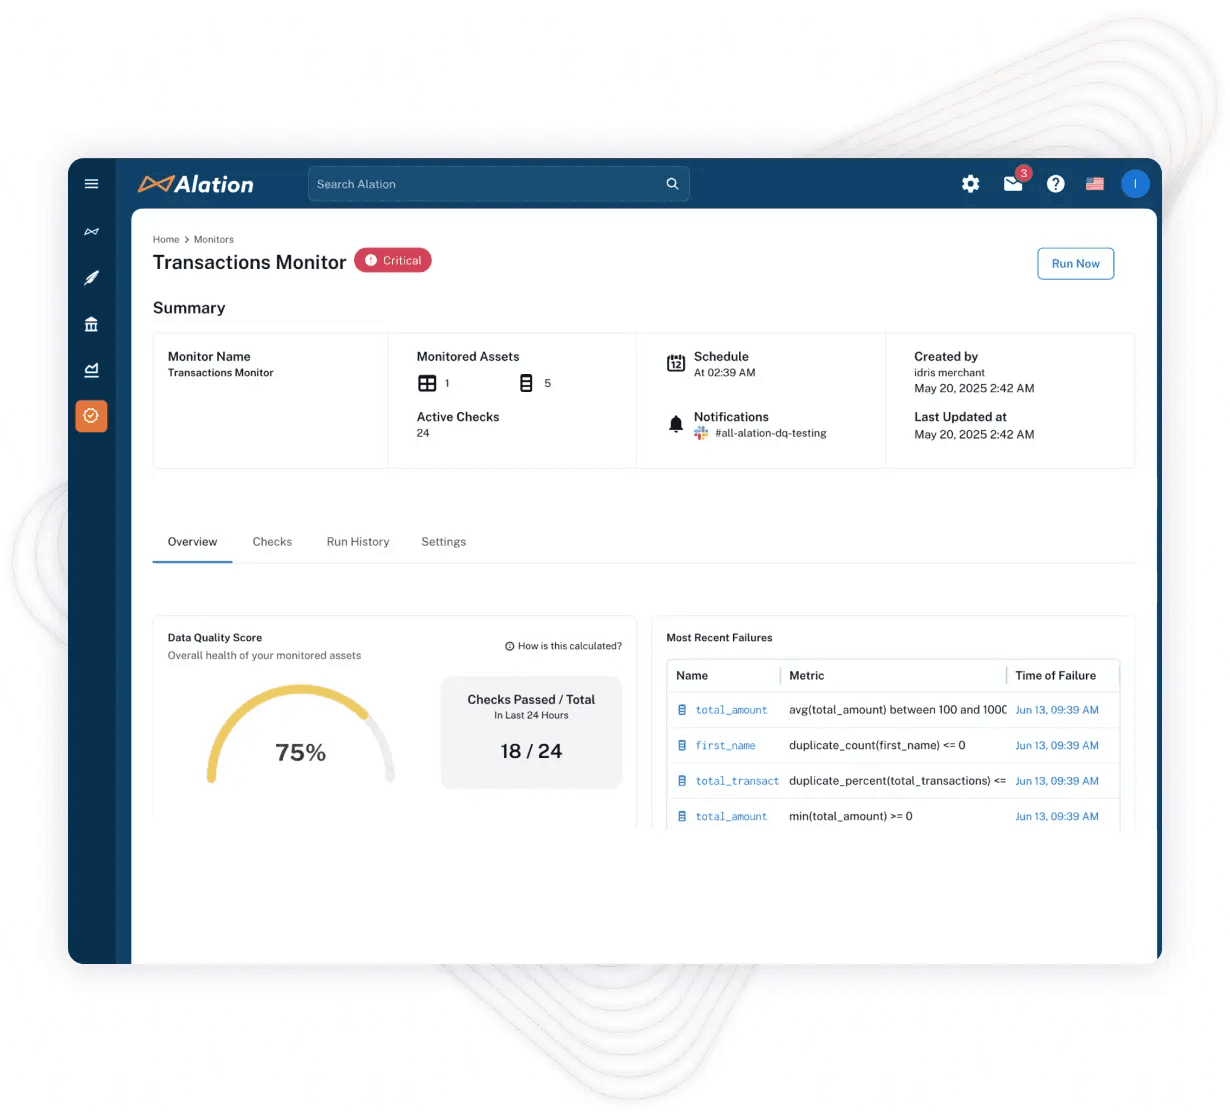
Use catalog-based monitoring tools
Data catalogs make it easier to perform data quality checks at scale. Alation’s Data Catalog, for example, enables teams to monitor metadata, lineage, and usage in one place. As shown below, it then sends alerts when anomalies or issues appear.
Teams often supplement catalogs with lightweight SQL or ETL checks alongside dedicated tooling. This method creates a scalable approach with supporting architecture and clear product relevance.
Reports help teams spot problem areas quickly and guide remediation. Over time, catalog-based monitoring boosts data reliability and user trust, supporting more confident analytics and AI initiatives.
Building on this, data quality monitoring tools give stakeholders a targeted view of recurring issues, helping them prioritize the datasets that matter most. They prevent errors from snowballing and improve AI model accuracy. Together, these tools enhance operational efficiency and impact the bottom line.
--> Learn more about agentic data quality.
Improve your organization’s performance across data quality dimensions
As businesses generate and depend on more data than ever, its quality directly impacts decisions, revenue, and customer trust. Low-quality data, by contrast, creates costly mistakes and missed opportunities.
The challenge is knowing where to start with data quality management and measurement, especially at enterprise scale. Dimensions such as accuracy, completeness, and timeliness are essential, but without specific metrics tied to them and the right tools, tracking quickly becomes overwhelming. That’s where Alation helps. Its data catalog makes it easier to monitor key metrics, flag issues early, and keep data reliable.
To learn how to build a scalable approach to data quality, download our whitepaper: Data Quality for AI Readiness: What You Need to Know.
Curious to learn more about how a data catalog can help you improve your metadata quality and drive business results? Book a demo with us today.
- Key takeaways
- What are data quality dimensions?
- The 9 most common data quality dimensions that organizations track
- Why AI readiness requires granular data quality tracking
- What data quality metrics should you track?
- How can you influence data quality dimensions?
- How can you monitor data quality at scale?
- Improve your organization’s performance across data quality dimensions
Contents
Tagged with
Loading...