The Second Pillar of Data Culture: Data Literacy

By Aaron Kalb
Published on June 22, 2021

Of the three pillars of data culture, data literacy is the most challenging to achieve, since it requires broad up-skilling across the organization and, sometimes, fighting human nature itself. As decision science author and Cornell professor J. Edward Russo once said, “the first thing most people will do when given access to tools and data is selectively filter information to prove previously established conclusions.” Psychology—in this example, confirmation bias—runs deep.
According to Gartner, poor data literacy is ranked as the second-biggest internal roadblock to the success of the chief data officer (CDO).
This post, the third in a four-part series on data culture, focuses on data literacy. The first post in the series defines data culture, its benefits, and the three pillars of data culture. The second and fourth posts take a deeper look at data search & discovery and data governance, respectively.
What is Data Literacy?
Per a recent article on Dataversity, “data literacy is the ability to read, work with, analyze, and argue with data.” While this is an excellent working definition, we believe it’s helpful to think of data literacy by analogy to Maslow’s Hierarchy, where needs (or skills) are layered atop each other.
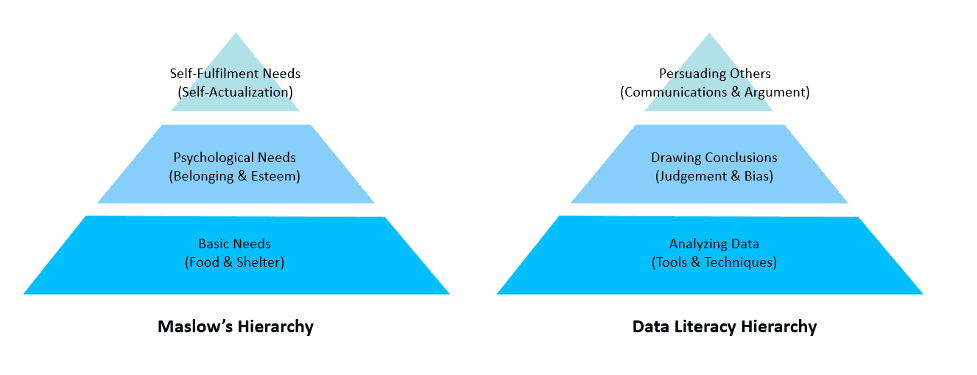
In our data literacy hierarchy, we have three layers:
Analyzing data. The food & shelter of data literacy is the ability to analyze data using a broad range of techniques and tools. While this layer includes many skills and abilities, the hierarchy illustrates that these skills alone represent a fraction of data literacy. This is not to minimize the work involved in building competencies at this layer, but to recognize that analytical skills and data access are increasingly becoming “table stakes” in the world of data culture. And in fact, being able to pull a dataset or visualize it can do more harm than good if you interpret it incorrectly.
Drawing conclusions. The next level of data literacy is drawing accurate conclusions from data. Choosing from a wide variety of data sources and analytical techniques, we must be able to draw correct conclusions from data to answer business questions, without getting confused or misled. This requires judgement as to which techniques are most appropriate for a given class of question, understanding the limits of both the data and the analysis, and remaining vigilant for the myriad forms of cognitive bias that can steer us away from rational inference.
Persuading others. The highest level of the data literacy hierarchy is the ability to persuade others. Like Cassandra of Troy (cursed to utter true prophecies but be ignored), people with analytical skills may be burdened by their insights if they can’t convince their leaders to listen. With data, persuasion starts with the basics of properly visualizing data, moves on to data-driven design, and peaks at storytelling with data. Ultimately, to persuade others you need to present information clearly, credibly, and with a convincing narrative. WARNING: if you teach people how to persuade with data (e.g. by offering a visualization best-practices course), before you teach people how to skeptically review analyses, then you’ll actually increase sophistry and reduce rationality in your organization.
Data literacy is not just about enabling people to argue with data, but to enable and empower people to argue against fallacious arguments made using data. In our desire to build data cultures, we need to promote broad data literacy to foster data-driven debate by all, instead of a two-tiered organization where data-insiders bully the data-outsiders.
How to Build Data Literacy
Of the three pillars of data culture – data search & discovery, data literacy, and data governance – data literacy is most focused on people and skills vs. software and systems.
Practitioners, consultants, and vendors have written a lot of material on how to build data literacy in an organization:
These approaches generally share a common framework:
Start with an assessment
Build a plan to promote data literacy, typically starting in an area and then expanding
Run an education and “internal marketing” program to promote data literacy as a means to data culture and data-driven decisions
Lead by example
Training in Advance, Warnings in Real-Time
One way to think about data literacy is by analogy to media literacy. In a media literacy lesson, students are taught to check citations and be vigilant for signs of bias before blindly trusting what they read. Nowadays, sites like Wikipedia use metadata to reduce the risk of a less media-literate individual getting hoodwinked. For example, Wikipedia adds a warning to articles containing too few citations:
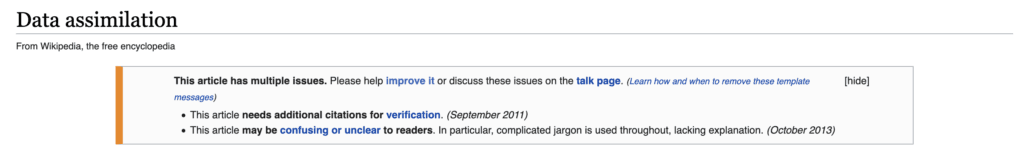
In the same way, curated and contextualized metadata can enable correct interpretation of quantitative datasets (and prevent common mistakes), even among a less-well-trained population.
For example, imagine a DOB field encoding date of birth for users or employees, which defaults to Jan 1, 1970 when someone’s birthdate is unknown (this can really happen, when NULL values convert to 0s then convert to certain kinds of dates!). If there are many records with that default, then the average value of that DOB field will be very misleading, and will produce skewed results (a bar chart of ages by decade produced in the 2020s would show a disproportionate number of 50-somethings).
A good data literacy course could teach folks to be wary when working with date fields. But if someone missed that day (or just forgot what they’d learned—we’re only human after all) they may still draw false conclusions. But if they see a warning on the catalog page for the DOB field, they’re alerted to the risk and can avoid data disaster! If the catalog can point them to a derived view where the potentially misleading 1970-01-01 values are filtered out, then they can do a more accurate age analysis without being a data expert.
The Role of Data Catalogs in Data Literacy
While data literacy is not primarily a software problem, software can certainly help enable data literacy initiatives. Although data catalogs were initially used to support data search & discovery, users quickly realized that the data catalog was not only a great place to find data, but to understand it as well.
Hence, data catalogs developed features for users to collaborate around data and enhance understanding. These features flesh out assets with useful context. Just as Wikipedia flags questionable content with caveats, so too a data catalog can flag deprecated data or highlight warnings (which, like Wikipedia, are informed by user feedback).
Catalog context comes in many forms. Articles and conversations showcase dialogue around data. Expert identifications let users quickly find the subject-matter experts. Data usage information spotlights popular behavior patterns, showing how others most often filter or combine a given asset.
These features empower data literacy to an advanced degree. Users don’t just have easy access to data—they have crucial clues about its history. Such context enables potent understanding, further advanced by the ability to collaborate with others in its interpretation.
In this way, data catalogs continue to evolve into full-featured data intelligence platforms that support a broad range of applications, including data search & discovery, data governance, cloud data migration, digital transformation, and many others. Data intelligence is a key to building a data culture in the same way that CRM is a key to building customer intimacy.
In our final post in this series, we’ll look at the third pillar of data culture, data governance.
- What is Data Literacy?
- How to Build Data Literacy
- Training in Advance, Warnings in Real-Time
- The Role of Data Catalogs in Data Literacy
Contents
Tagged with
Loading...