How Alation’s Data Team Uses the Modern Data Stack to Power Insights

By Jason Lim
Published on October 27, 2022

Few actors in the modern data stack have inspired the enthusiasm and fervent support as dbt. This data transformation tool enables data analysts and engineers to transform, test and document data in the cloud data warehouse. But what does this mean from a practitioner perspective?
To answer this question, I sat down with members of the Alation Data & Analytics team, Bindu, Adrian, and Idris. Some may be surprised to learn that this team uses dbt to serve up data to those who need it within the company. In celebration of last week’s dbt Coalesce, their flagship event, I interviewed the D&A team to learn more about how they leverage dbt to support excellence in analytics.
Jason Lim, Director of Product and Cloud Marketing, Alation: Thanks for agreeing to speak with me today. Let’s dive in. What do you do at Alation?
Bindu Chandramohan, Lead, Data Analytics, Alation: Thanks, Jason! Happy to chat. Our team is focused on delivering insights and useful reporting to internal teams. We specialize in multiple functions, which include but are not limited to, data governance, dashboarding, data & analytics engineering, and data science. At Alation, we focus most of our time on connecting data sources and building useful data transformations to provide reporting for different teams.
Julie Smith, Director of Data & Analytics, Alation: We follow a federated model at Alation; that means the D&A team builds out core data resources for both our own team and the various business units. We provide the center of expertise for multiple disciplines. The extraction, transformation and delivery of data products is one such discipline, so having the right technology stack to support a wide range of sources and requirements is important to us. Like so many data teams out there, we need to maximize our throughput whilst ensuring quality.
Jason: I’m curious to learn about your modern data stack. What tools do you use?
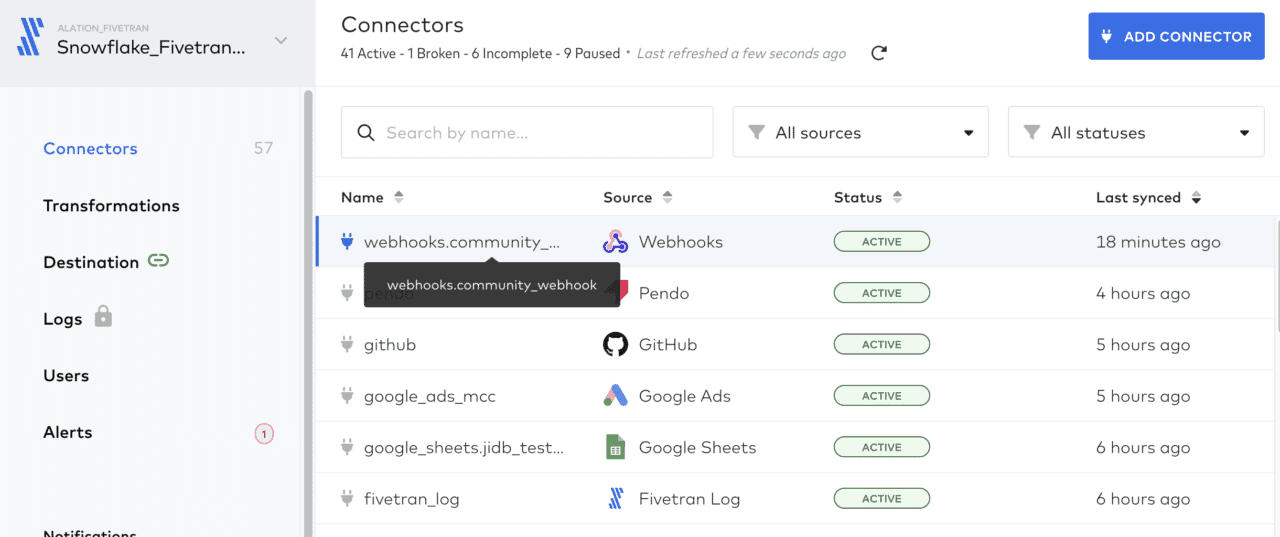
Adrian Lievano, Senior Data Scientist, Alation: Most of our data sources are connected and extracted using Fivetran, and then transported to raw storage in Snowflake. Using dbt, we build staging, intermediate, and metric stores for each team at Alation.
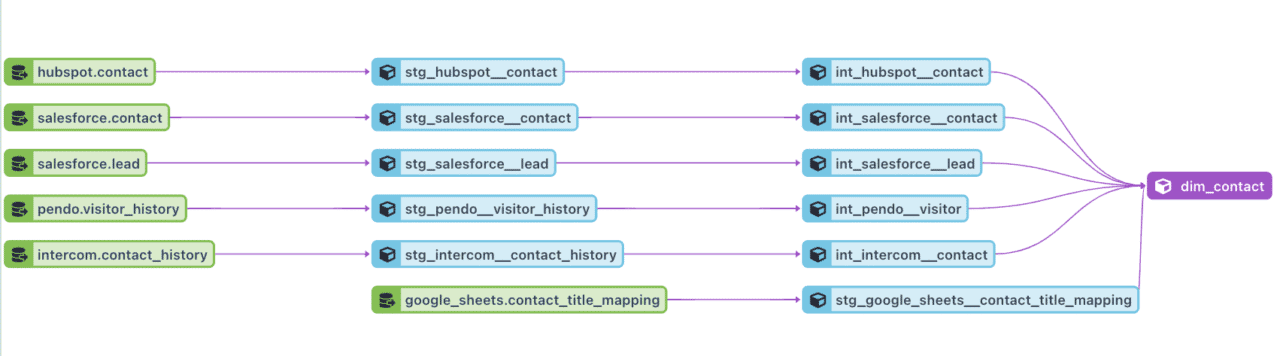
Intermediate and metric layer data stores contain logic that combines data from multiple tools; for example, certain tables track and merge contact information from tools like Hubspot, Salesforce, Intercom, Pendo, and more. We document these custom models in Alation Data Catalog and publish common queries that other teams can use for operational use cases or reporting needs.
Jason: How do you use these models? Can you share any use cases or examples?
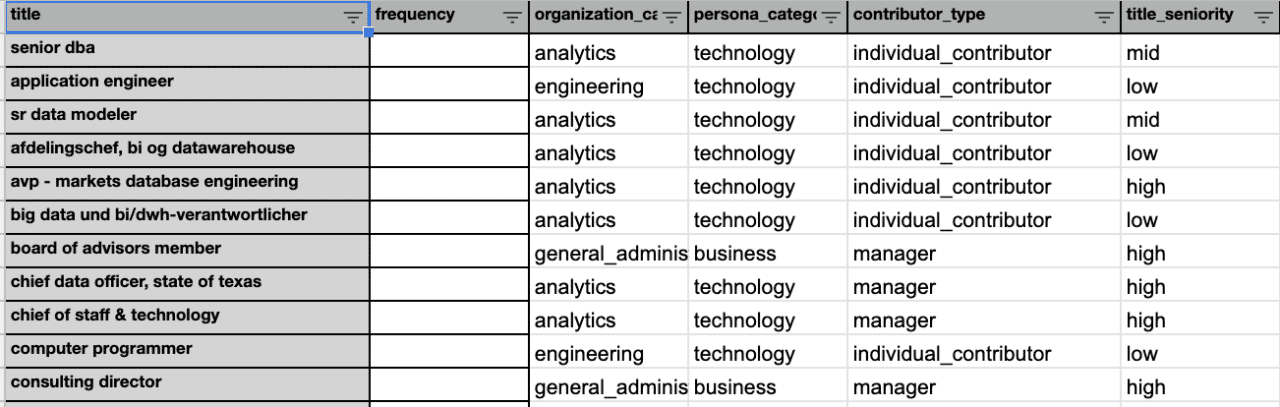
Adrian: One of our more important use cases powers our ability to understand our customer’s buyer personas across sales, marketing, and product. For this use case, we leveraged Fivetran, dbt, and Alation to build an internal tool that estimates unique buyer personas. We built custom mappings that took a job title from a lead to extrapolate useful insights. Now, we can understand that one lead’s lifecycle across our marketing and sales funnels, right on through to product engagement.
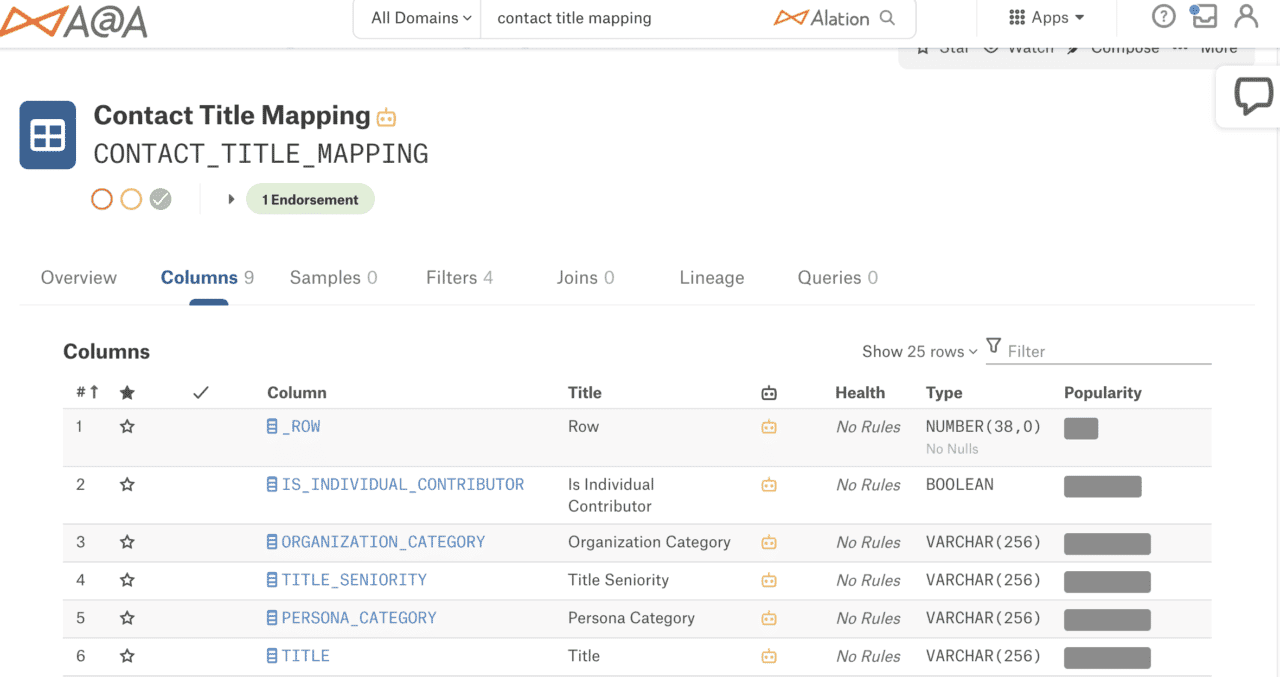
First, we pulled unique contact titles into a Google Sheet from Hubspot and other sources, and tagged them with internal attributes; this helps downstream analysts get work done.
We also populated our internal data catalog with these descriptions. So if anybody has a question about what a specific job title signifies, they can easily look it up.

Next, we ingest the Google Sheet data into the Snowflake Data Cloud using Fivetran.
Downstream of Snowflake, now that we’ve used that mapping and built queries with it, we can build visualizations that leverage those mappings. This graph is an example of one analysis, documented in our internal catalog. It helps product teams understand how different personas are engaging with the product.‘
This enables us to understand, with granularity, who is interacting with certain assets in certain ways. It’s a powerful view into understanding our users more deeply.
Jason: What’s the value of using dbt with the data catalog?
Idris Kavak, Data Analyst, Alation: Much of a teammate’s time to onboard a new project or team is dedicated to learning the data tables. However, with a data catalog, team members can share insights and quickly understand what each column in a table means. This empowers newcomers to write better queries with a higher degree of accuracy, since they know how each column is being used. It also results in more satisfied business users because the data is correct and there isn’t a source-of-truth conflict.
Jason: Tell me more about how your team uses Alation, Fivetran, and dbt together. How does this help the end user?
Adrian: Fivetran and dbt enable us to easily connect data sources and write SQL transformations to power downstream dashboards and reporting. Using a catalog with these tools makes it easier for us to share insights and to give end-users helpful data context so they understand what each table or column represents. This saves business users’ time, reduces ad hoc requests, and pushes domain expertise from the data team to the business users. With our catalog we increase the trust our business users have with the end delivery of data assets. In this example, contact titles are ingested via Fivetran and downstream transformations are applied via dbt.
Julie: Over the years I have witnessed and worked with multiple variations of ETL/ELT architecture. When I arrived at Alation I knew we needed something which would be agile in development but also quick to deploy and learn. This combination of toolsets has really delivered this to us, especially when combined with our own Alation instance. Having the data cataloged from source through into target models – and populated by dbt – provides us with key documentation and other teams with a user guide for self-service BI.
Jason: I’d love your perspective on Alation as a platform. What are the benefits of using a single catalog to collaborate with multiple roles and stakeholders across the company?
Adrian: Each team member, through their experiences in various domains and projects within the company, understands the nuances in the data: some analysts work closer to marketing, and others are closer to product. By leveraging a catalog to document our understandings of the different data models that power these teams, we capture a diverse range of tribal knowledge. And we know the source of truth of different data columns, wherever they sit. This means we can productively onboard new projects and teams much more efficiently.
Julie: Using Alation as a platform simplifies workflows for a wide range of user types, be they a data scientist, data analyst, data engineer, or ops analyst embedded within a business unit: the location, format and method to access the information is the same across the board. Plus, when you search for something in Alation, you know you are getting the benefit of all possible sources without having to repeat the exercise in separate places. This is a real time saver, and its simplicity encourages its use.
Tagged with
Loading...