Troubleshoot the Agent
Alation Cloud Service Applies to Alation Cloud Service instances of Alation
Important
You are viewing documentation for Alation’s Classic User Experience.
This section will help you troubleshoot issues with the Agent. Issues may include:
Agent is in a “Disconnected” status.
Agent connectors are in an “Unknown” status.
Error when installing new connectors.
If network interruptions ever break the connection between the Agent and your Alation Cloud instance, the Agent will attempt to reconnect. It keeps trying to connect using an exponential backoff algorithm. Once the Agent can connect to your Alation Cloud instance again, it will reauthenticate and reestablish a secure connection.
Any jobs, such as metadata extraction, that were underway will automatically restart as long as the connection is reestablished within 30 seconds. If it takes longer than that, you’ll have to restart the job manually.
Diagnose Agent Connectivity Problems
Applies to Agent versions 1.5.0.2541 and later
Alation Agent versions 1.5.0.2541 and later come packaged with a suite of diagnostics that you can use to troubleshoot connectivity issues when deploying the Agent. These checks include (but are not limited to):
Operating system, memory, and CPU compatibility.
Configuration of the Agent.
Expired or revoked security certificates.
Issues related to DNS resolution and establishment of a TCP connection to Alation Cloud Service.
To use the diagnostic tools, log into the Agent host machine. Some of the most useful commands are shown below.
To get help information about the diagnostics tool:
kratos diagnostics help
To save the logs for all Agent components, including connectors, to the /tmp directory:
kratos diagnostics logs -o /tmp
To get a list of available diagnostics:
kratos diagnostics list
To run all diagnostics and save the results to a file:
kratos diagnostics run >> agent_diagnostics.yaml
You can send the resulting file, which includes the output logs of the diagnostics, to Alation Support to enable faster diagnosis of Agent connectivity problems.
Check the System Requirements
Verify that the Agent’s host machine meets the Agent System Requirements.
Check the Agent Version
Ensure that you have installed the latest version of the Agent.
On the Agent host machine, check the installed Agent’s version by running:
hydra versionThe version number will be in the first line of the output.
Go to the Alation Customer Portal. If prompted, log in.
On the Alation Customer Portal, check the latest version number under the Version column. If it’s newer than the Agent you have installed, upgrade the Agent.
Check the Agent’s Status
As a troubleshooting step, or when starting and stopping the Agent, you may want to check the Agent’s status.
Agent Status in Alation
In Alation, you can check the Agent’s connection status by visiting Admin Settings > Agents.
In Alation, you can check the Agent’s connection status by visiting Admin Settings > Manage Connectors > Agents Dashboard.
The Agent’s Status tells you if your Alation Cloud instance can reach the Agent.
Agent Status on the Agent’s Machine
You can check the status of the Agent’s individual components on the Agent’s host machine. To check the status, run the following command:
sudo docker ps
This command will output a list of running Docker containers. A normally functioning Agent will show several containers:
agent: This is the component that manages the connectors that are installed on the Agent.
proxy: This is the component of the Agent that communicates with Alation Cloud Service.
auth: This is the Authentication Service add-on, if installed.
connector_[n]: Each connector will be listed with n representing the connector’s ID.
Note
If the Query Service Add-on is installed, its components (queryservice, traefik, and zerodatahealth) run as k3s pods and don’t appear in docker ps output. To check their status, run sudo k3s kubectl get pods -A. See Troubleshoot the Query Service Add-on for details.
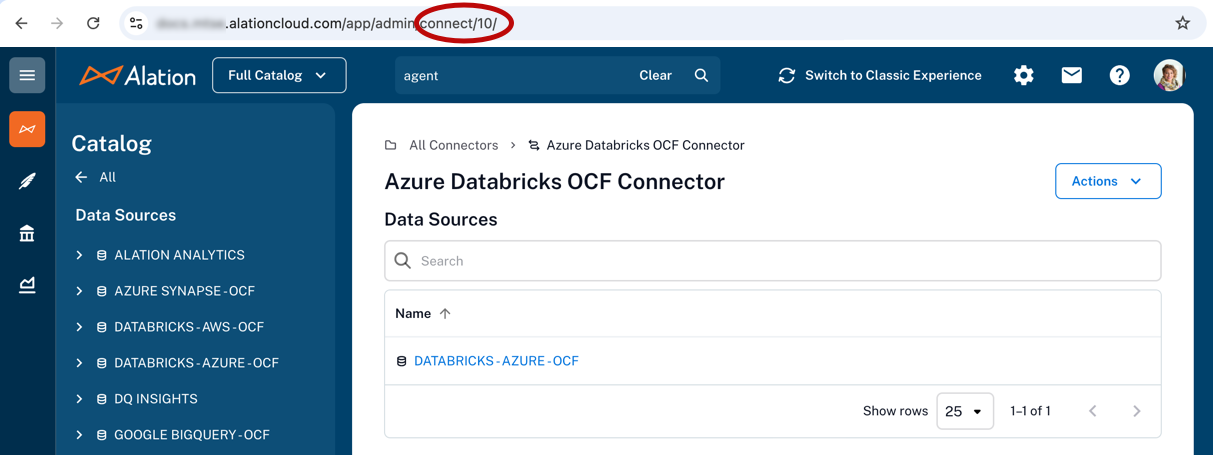
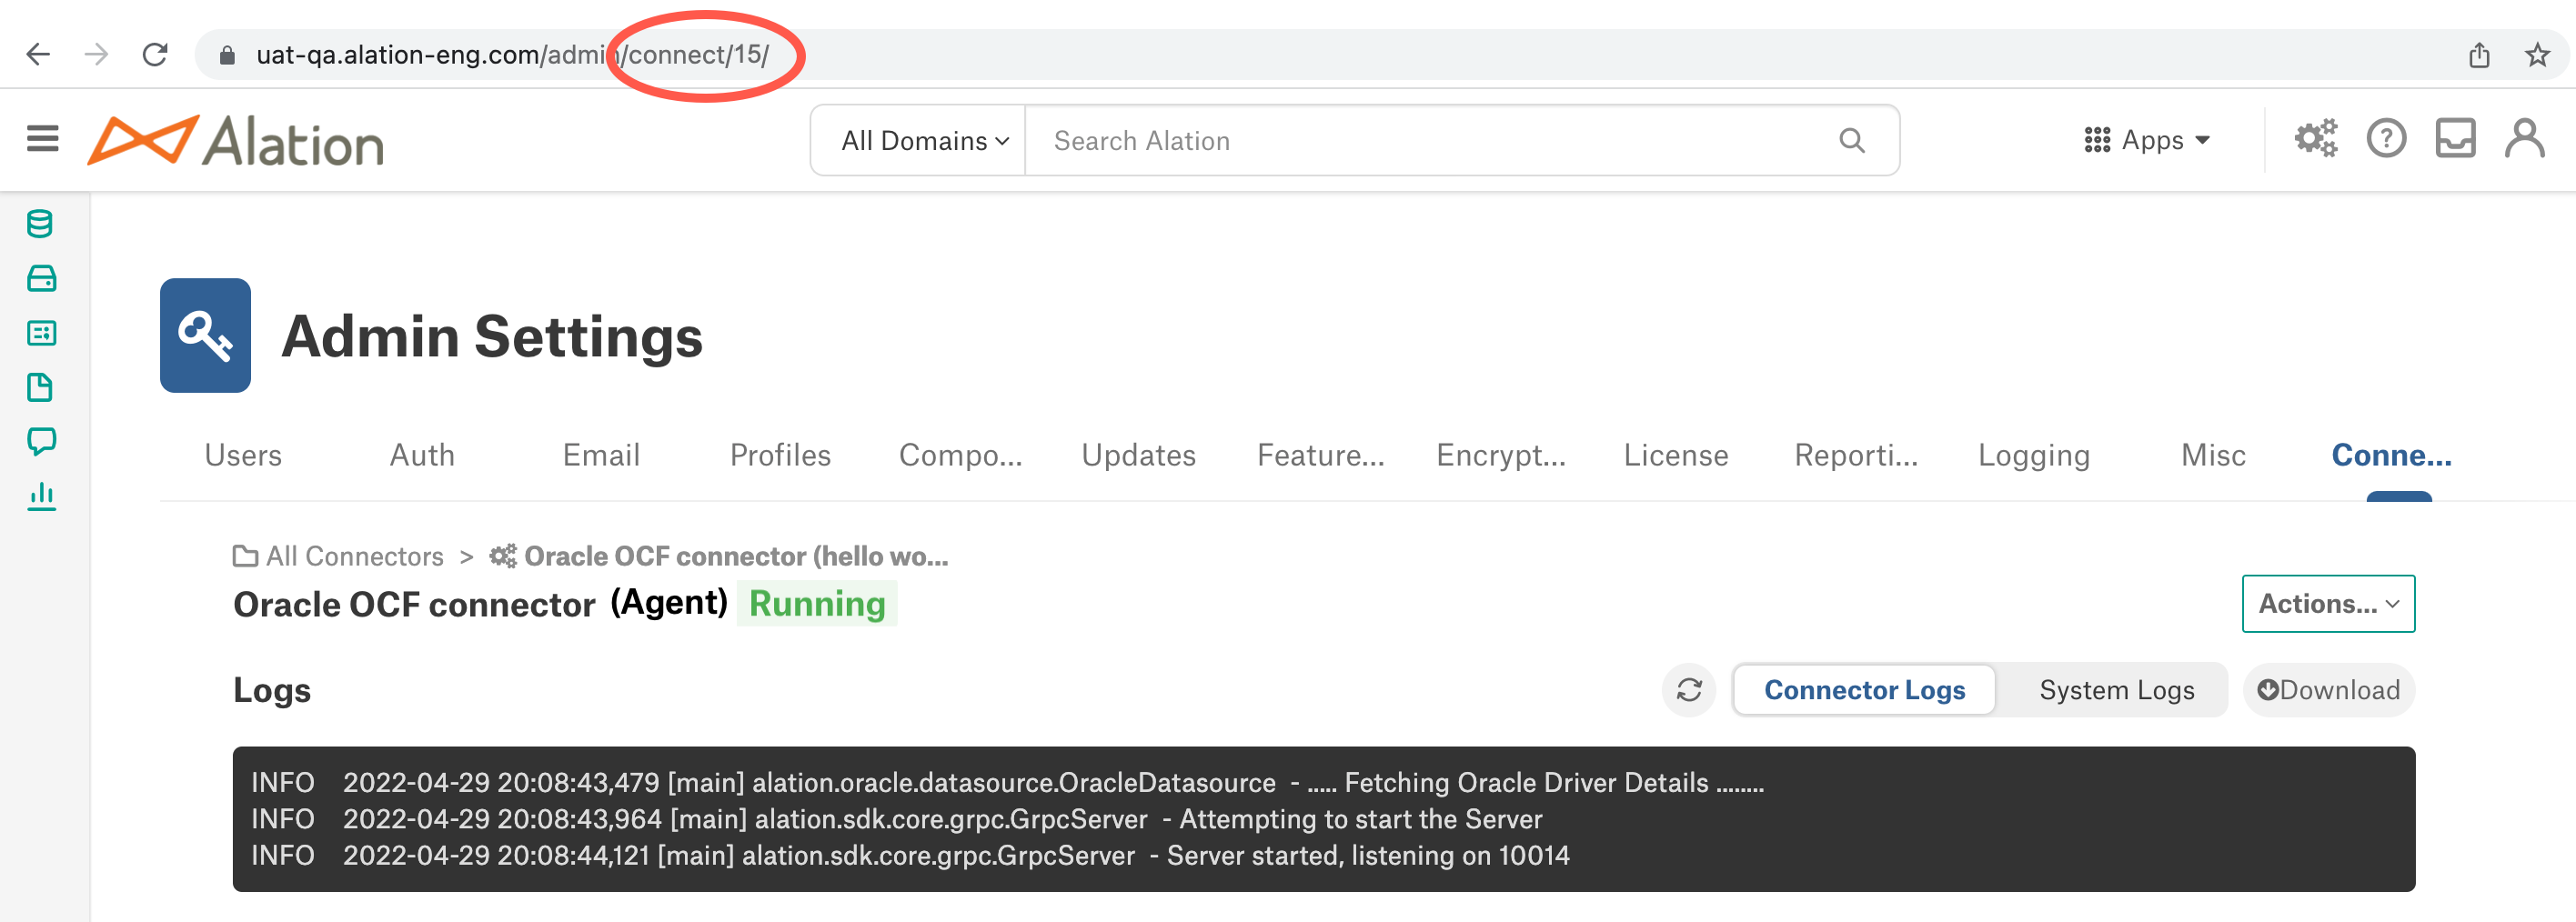
You can correlate the ID with the connectors on the Connectors Dashboard in Alation by clicking on a connector and viewing its URL.
If any components are missing from the list, that means they are not running. You can try to restart the Agent and its components using the instructions below.
Restart Agent Components
To start up Agent components that are not running, you can try the following steps:
Restart the Agent by running the following command on the Agent’s host machine:
sudo hydra restart
Restart Docker:
sudo systemctl restart docker
Check the status of the Agent’s components again:
sudo docker ps
Check the Certificates
If the Agent shows as disconnected, it may be that the Agent’s certificates have expired or been revoked. The certificates expire automatically after one year.
To check if the Agent has valid certificates, see View the Certificates’ Expiration Date. If the Agent does not have valid certificates, see Renew the Certificates to reestablish the connection. Do not add a new Agent, as doing so will not solve problems with certificates and may cause additional problems.
Update the Agent’s Address Configuration
If the Agent is in a disconnected status, you may need to update the Agent’s address configuration. For instructions, see Configure Agent Address.
Check Agent Error Messages
To view Agent error messages, run the following command on the Agent’s host machine:
sudo systemctl status hydra.service
Check Logs
Each component of the Agent writes its own logs on the Agent host machine. Each connector that’s installed on the Agent also has its own logs. On the Agent machine, you can get an archive of all logs or check the logs for each component and connector separately. Connector logs are also available directly in Alation.
All Logs
You can get an archive of all Agent component logs, including connector logs, using the Agent diagnostics tool on the Agent machine.
To save all Agent logs to the current working directory:
kratos diagnostics logs
To save all Agent logs to a specified directory:
kratos diagnostics logs -o /tmp
Agent Component Logs
To check the Agent’s logs, you’ll need to know the name of the Docker container for the component you’re checking. To get the names of the containers, run the following command on the Agent’s host machine:
sudo docker ps
In the output, the NAMES column shows a list of the Agent’s components.
agent: This is the component that manages the connectors that are installed on the Agent.
proxy: This is the component of the Agent that communicates with Alation Cloud Service.
auth: This is the Authentication Service add-on, if installed.
connector_[n]: Each connector will be listed with n representing the connector’s ID.
Note
If the Query Service Add-on is installed, its components (queryservice, traefik, and zerodatahealth) run as k3s pods and don’t appear in docker ps output. To check their status, run sudo k3s kubectl get pods -A. See Troubleshoot the Query Service Add-on for details.
You can correlate the ID with the connectors on the Connectors Dashboard in Alation by clicking on a connector and viewing its URL.
Access the logs using the docker logs command followed by the name of the container. For example:
# tail logs for Alation Connector Manager component
docker logs -f agent
# tail logs for proxy component
docker logs -f proxy
# tail logs for the Authentication Service add-on, if installed
docker logs -f auth
# save logs to a file
docker logs agent >& agent.logs 2>&1
docker logs proxy >& agent.logs 2>&1
Query Service Add-on Logs
You can download the Query Service Add-on logs directly from the Alation UI:
Click on the Settings icon in the top right corner.


The Admin Settings page appears. Under the Platform Settings section, click Agents.
Under the Server Admin section, click Manage Connectors. Then click the Agents tab. The Agents Dashboard appears.
Click the Agent name to open the Agent detail view.
Click the Agent Action menu.
In the menu, locate the Download Logs section and download the logs.
Connector Logs
Each OCF connector has logs that record information about actions such as metadata extraction and query log ingestion. Logs for OCF connectors installed on the Agent are available from the Connectors Dashboard. See Connector Logs for more information.
To view OCF connector logs on the Agent’s host machine:
Get the ID of the connector by running
kratos listand looking for the “id” field. Or runsudo docker psand look for the number following the underscore in the container name.Use the commands below to work with the connector logs as desired:
# Tail logs
kratos tail <ID>

# Get full logs
kratos logs <ID>

# Get logs from a specific date
kratos logs --since 2024-08-15 <ID>

# Redirect logs to a file
kratos logs <ID> > connector_3.log 2>&1
Troubleshoot the Query Service Add-on
If the Query Service Add-on isn’t working correctly, find the section below that matches the error you’re seeing. Each section follows the same structure: Problem describes what you see and where, Cause explains why it happens, and Solution gives the steps to fix it.
Zero Data Install Fails with “ERROR: no package matching ‘zerodata*.rpm’ found”
The Zero Data Agent installation script fails because it can’t find the zerodata RPM in the installation directory.
Problem
You are installing the Alation Agent with the Zero Data feature for the first time. From the extracted ocf-agent directory on the Agent host, you run:
sudo ./install.sh --zerodata
The installer exits early and prints:
ERROR: no package matching 'zerodata*.rpm' found
The Agent isn’t installed and Zero Data isn’t configured. You can’t move forward with the rest of the install workflow until this is resolved.
Cause
The installer expects a zerodata-*.rpm file in the same directory as install.sh. The file is missing for one of two reasons:
You downloaded the DEBIAN package from the Customer Portal. The K3s-based
zerodatapackage is RPM-only and ships only with the RHEL Agent package. See Zero Data Support Matrix for the supported host operating systems.The download was incomplete, or the tar archive was extracted into the wrong directory.
Solution
Confirm your Agent host runs a Red Hat-family operating system (RHEL, AWS Linux, Oracle Linux, or CentOS). If it’s a Debian-family host, move the Agent to a supported host first.
Re-download the RHEL Agent package from the Alation Customer Portal.
Extract the tar archive and change into the extracted
ocf-agentdirectory:cd ocf-agent
Confirm both packages are present in the directory:
ls *.rpmYou should see both
ocf-agent-*.rpmandzerodata-*.rpm.Re-run the installer:
sudo ./install.sh --zerodata
Zero Data Install Fails with “ERROR: platform detection failed, this system requires yum, dnf, or apt”
The Zero Data Agent installation script exits without recognizing the host’s package manager.
Problem
You run sudo ./install.sh --zerodata on the Agent host and the installer prints:
ERROR: platform detection failed, this system requires yum, dnf, or apt
No packages are installed and the Agent doesn’t come up.
Cause
The Agent installer requires yum, dnf, or apt. The host’s operating system either doesn’t ship one of these package managers or has had it removed. This usually means the host isn’t on the supported operating systems for Zero Data.
Solution
Confirm the OS family by inspecting
/etc/os-release:cat /etc/os-releaseCompare the result to Zero Data Support Matrix. The K3s-based Zero Data runtime is supported on RHEL-family hosts only.
Move the Agent to a supported host. Re-run the installer there.
If the host is on the support matrix but the package manager really is missing, contact your system administrator to restore it before re-running the installer.
Hydra Service Fails to Start with “Job for hydra.service failed”
The Agent service won’t start after the Zero Data install completes.
Problem
You ran sudo ./install.sh --zerodata and the script completed. After the install, the Agent service is in a failed state. Running:
sudo systemctl status hydra.service
shows:
Job for hydra.service failed because the control process exited with error code.
See "systemctl status hydra.service" and "journalctl -xe" for details.
The Agent doesn’t connect to Alation Cloud Service and Zero Data ingress traffic isn’t served.
Cause
The Agent process exits during startup because of a configuration or environment problem. The most common causes are:
The
[ingress]section is missing from/etc/hydra/hydra.toml(Zero Data requireshostname,certificate_path, andkey_pathtogether).The certificate or key file referenced in
hydra.tomldoesn’t exist or isn’t readable byroot.Port 443 is already in use on the host by another service.
Solution
Read the most recent service logs to identify which of the three causes applies:
sudo systemctl status hydra.service
sudo journalctl -u hydra.service -n 200 --no-pager
Apply the matching fix:
Missing ingress configuration: Edit
/etc/hydra/hydra.tomland add the[ingress]block withhostname,certificate_path, andkey_path. See Configure Zero Data Ingress.Cert or key file unreadable: Verify the files exist and are owned by
rootwith the right permissions:sudo ls -l /etc/hydra/certs/
Re-issue or re-copy the cert and key into
/etc/hydra/certs/if needed.Port 443 in use: Identify the conflicting service:
sudo ss -tlnp | grep ':443'
Stop the conflicting service or move it to a different port.
Restart the Agent:
sudo systemctl restart hydra.service
Confirm the service is now running:
sudo systemctl status hydra.service
Zero Data Install Fails with “No space left on device”
The installer aborts with a disk-space error before the Agent comes up.
Problem
You ran sudo ./install.sh --zerodata and the installer exits with:
No space left on device
The Agent isn’t installed and Zero Data isn’t configured.
Cause
The K3s-based Zero Data runtime needs more disk than the standard Agent. K3s stores container images and pod data under /var, which fills quickly during install if the partition doesn’t have enough free space.
Solution
Check free space on the host:
df -h /var
Free up space, expand the partition, or attach a larger volume so that
/varhas at least 40 GB of free space available. See Zero Data Support Matrix for the full hardware sizing.Re-run the installer:
sudo ./install.sh --zerodata
K3s Pods Fail to Start with SELinux Permission Denied Errors
K3s pods can’t start on a host running SELinux in enforcing mode.
Problem
You completed the Zero Data install, but the K3s pods don’t reach the Running state. Running:
sudo k3s kubectl get pods -A
sudo k3s kubectl describe pod -n <namespace> <pod-name>
shows pods stuck in CrashLoopBackOff or Error, with events that mention permission denied accessing container directories. The Agent host runs SELinux in enforcing mode (getenforce returns Enforcing).
Cause
SELinux blocks K3s from accessing the directories and processes it needs because the container-selinux policy isn’t installed on the host. Without that policy, the K3s container runtime can’t create or run pods.
Solution
Install the
container-selinuxpolicy package and re-run the Zero Data installer (RHEL 8 / 9):sudo yum install -y container-selinux sudo ./install.sh --zerodata
Confirm the K3s pods come up:
sudo k3s kubectl get pods -A
If the pods still fail, temporarily set SELinux to permissive mode to confirm SELinux is the cause:
sudo setenforce 0
sudo systemctl restart hydra.service
If the pods now start, the cause is confirmed. Work with your security team to define the right SELinux policy before returning to enforcing mode (
sudo setenforce 1).
K3s Panics with “iptables (nf_tables): Parsing nftables rule failed”
K3s exits during startup with an iptables/nftables parse error.
Problem
You completed the Zero Data install, but the Agent service keeps failing. K3s runs as the zerodata systemd unit on the Agent host. Running:
sudo journalctl -u zerodata.service -n 200 --no-pager
shows a K3s panic from network_policy_controller.go:
F0423 23:28:05.543673 ... network_policy_controller.go:398] Failed to verify rule exists in INPUT chain ...
iptables v1.8.10 (nf_tables): Parsing nftables rule failed
Perhaps iptables or your kernel needs to be upgraded.
K3s never reaches a Ready state and Zero Data ingress traffic isn’t served.
Cause
The host’s iptables userspace utility is out of sync with the kernel’s nftables backend. K3s tries to install network-policy rules through iptables, the userspace tool emits rules in a format the kernel can’t parse, and K3s panics on the verification step.
Solution
Pick the option that matches your environment, in order of preference:
Upgrade
iptablesso the userspace utility supports the kernel’snftablesbackend:sudo yum update -y iptables iptables-services
Reboot the host (or restart networking and the Agent) and re-run:
sudo systemctl status zerodata.service
If you can’t upgrade, switch
iptablesto the legacy backend so it bypassesnftablesrule emission:sudo update-alternatives --set iptables /usr/sbin/iptables-legacy sudo update-alternatives --set ip6tables /usr/sbin/ip6tables-legacy
Restart the host and verify K3s comes up cleanly:
sudo k3s kubectl get pods -A
If neither option resolves the panic, capture the full journalctl -u zerodata.service output and contact Alation Support.
Bucket Permission Errors When Reading or Writing Query Results
Compose query results fail to write or read after the Query Service Add-on is installed.
Problem
You are using Compose, sampling, or profiling against a data source that has Zero Data enabled. When the query runs, it fails with an object-store permission error in the query result panel or the Job History tab. Examples:
AccessDenied: User: arn:aws:sts::... is not authorized to perform: s3:PutObject on resource ...
or:
AuthorizationFailure: This request is not authorized to perform this operation.
The query results aren’t stored, and users can’t view, export, or download results.
Cause
The IAM role (AWS) or OIDC federated credential (Azure) used by the Query Service to access the Zero Data bucket doesn’t have the required permissions, or the trust policy isn’t correctly scoped to the Agent.
Solution
Confirm which object store the data source is configured to use (AWS S3 or Azure Blob Storage).
Verify the bucket-side permissions match Bucket Security Requirements:
AWS S3: Confirm the IAM role attached to the Agent has
s3:PutObject,s3:GetObject,s3:DeleteObject, ands3:ListBucketon the bucket.Azure Blob Storage: Confirm the OIDC federated credential is configured against the Microsoft Entra ID app registration the Agent uses, and that the app has the Storage Blob Data Contributor role on the container.
Apply the missing permissions in your cloud provider’s IAM console.
Re-run the failing Compose query to confirm the result writes and reads succeed.
JWT Authentication Errors When Accessing Query Results
Users see authentication errors when retrieving query results from the Agent ingress.
Problem
You are running Compose queries against a Zero Data-enabled data source. When the result panel tries to fetch results from the Agent ingress endpoint, the browser shows an authentication error such as:
401 Unauthorized
token expired
or a JWT validation error in the browser developer console.
Cause
The JWT token used to authenticate the request to the Agent ingress has expired or is being rejected. The most common cause is clock skew between the Agent host and the user’s browser. JWTs include short-lived iat (issued at) and exp (expiration) claims, and even a few minutes of drift on the Agent host causes the token to be considered expired.
Solution
On the Agent host, check the system clock and time-sync status:
timedatectl statusIf the System clock synchronized field is
noor the time is visibly off, sync the clock with your time daemon. Forchronyd:sudo systemctl restart chronyd sudo chronyc tracking
For
systemd-timesyncd:sudo systemctl restart systemd-timesyncd timedatectl timesync-status
Restart the Agent so new JWTs are issued from a synchronized clock:
sudo systemctl restart hydra.service
Re-run the failing Compose query. If the error persists, also confirm the user’s local machine has accurate time (browsers reject tokens whose
iatis in the future relative to the local clock).
CORS Errors When Retrieving Query Results
Browser fetches to the Agent ingress are blocked with a CORS error.
Problem
You are running a Compose query against a Zero Data-enabled data source. The query executes, but the browser can’t fetch the results from the Agent ingress endpoint. In the browser’s developer console (Network or Console tab), you see an error similar to:
Access to fetch at 'https://zerodata.yourcompany.com/...' from origin
'https://yourtenant.alationcloud.com' has been blocked by CORS policy
The query result panel never loads. The same query against a non-Zero Data data source works.
Cause
A browser-side mechanism is blocking the cross-origin request between Alation Cloud Service and the Agent ingress. The Agent’s ingress gateway is configured server-side to allow requests from your tenant’s Alation Cloud Service URL, so the block is happening in the browser, not on the Agent. The most common cause is a browser extension that disables or restricts CORS, or a corporate browser policy doing the same.
Solution
Open the browser developer console and confirm the failing request’s error mentions CORS or
Access-Control-Allow-Origin.List the active extensions in the browser. Look for any of the following categories:
CORS-disabling extensions: NoScript, uMatrix, “CORS Unblock”, “Allow CORS”.
Privacy or security suites that intercept network requests.
Enterprise-managed extensions pushed by a corporate browser policy.
Disable the suspect extension for the Agent ingress hostname (or for the Alation Cloud Service URL) and reload the page.
Re-run the Compose query. If the request now succeeds, the extension was the cause – whitelist the Agent ingress hostname permanently in that extension’s settings.
If no extension is in play and the error persists, capture the failing request’s full headers from the developer console and contact Alation Support.
TLS Errors at the Zero Data Ingress Endpoint
The Zero Data ingress endpoint can’t terminate TLS because the certificate or key in hydra.toml is invalid.
Problem
You configured Zero Data ingress and restarted the Agent, but a request to the ingress endpoint fails before any application response:
curl -v https://zerodata.yourcompany.com/_ping
returns an SSL handshake error, an empty reply, or a connection reset. Inspecting the Agent service logs:
sudo journalctl -u hydra.service -n 200 --no-pager
shows messages about the ingress certificate or key, such as failed to load certificate, no such file or directory, or unable to parse private key.
Cause
The TLS certificate or key path in /etc/hydra/hydra.toml is wrong, the file doesn’t exist, the file is unreadable to root, or the certificate and key aren’t a matching pair. Hydra reads these files at startup and uses them to populate the ingress-tls-secret that the IngressRoute serves; if Hydra can’t load them, the secret is never populated correctly and TLS termination fails.
Solution
Inspect the
[ingress]block in/etc/hydra/hydra.tomland confirm the values:sudo grep -A 4 '\[ingress\]' /etc/hydra/hydra.toml
hostname,certificate_path, andkey_pathmust all be set. See Configure Zero Data Ingress.Verify the certificate and key files exist at the configured paths and are readable by
root:sudo ls -l /etc/hydra/certs/
Confirm the cert and key are a matching pair. Their public-key moduli must match:
sudo openssl x509 -noout -modulus -in /etc/hydra/certs/ingress-cert.pem | openssl md5
sudo openssl rsa -noout -modulus -in /etc/hydra/certs/ingress-key.pem | openssl md5
The two
md5outputs must be identical.Restart the Agent so Hydra reloads the certificate and key:
sudo systemctl restart hydra.service
Re-run the ping endpoint to confirm the ingress is reachable:
curl -v https://zerodata.yourcompany.com/_ping
Browser Shows a Certificate Warning at the Ingress Endpoint
Users see “Not Secure” or a TLS warning interstitial when the browser opens the Agent ingress.
Problem
You are using Compose, sampling, or profiling against a Zero Data-enabled data source. When the browser fetches results from the Agent ingress endpoint (for example, https://zerodata.yourcompany.com), the user sees a browser TLS warning interstitial:
NET::ERR_CERT_AUTHORITY_INVALID
Your connection is not private
or, in some browsers:
This connection is not secure
The user has to click through the warning to view results, and many browsers block the fetch entirely.
Cause
The TLS certificate served by the Agent ingress isn’t trusted by the user’s browser. Most often this is one of:
The certificate is self-signed or signed by an internal CA that isn’t in the user’s browser trust store.
The certificate is missing the intermediate chain, so the browser can’t build a trust path back to a public root CA.
The certificate was issued for a different hostname than the one in the URL.
Solution
From the user’s machine, fetch the certificate the Agent is presenting and inspect it:
openssl s_client -connect zerodata.yourcompany.com:443 -servername zerodata.yourcompany.com -showcerts < /dev/null
Confirm the CN or one of the SAN values matches the hostname in the URL, and that the chain shows an issuer that should be trusted.
Apply the matching fix:
Self-signed or internal CA: Re-issue the certificate from a public CA, or install your internal CA in the user’s browser trust store.
Missing chain: Re-issue the cert with the full intermediate chain in PEM order (server cert first, then intermediates), update
/etc/hydra/certs/ingress-cert.pem, and restart the Agent (sudo systemctl restart hydra.service).Hostname mismatch: Re-issue the cert with the correct CN or SAN for your ingress hostname, replace the file under
/etc/hydra/certs/, and restart the Agent.
See Configure Zero Data Ingress for end-to-end guidance on obtaining and installing a usable certificate.
Restart Marker Error After Upgrading on a Rootless Host
The Agent logs report a restart marker error after a Zero Data upgrade on a rootless install.
Problem
You have an existing rootless Agent install, and you ran the Agent upgrade with the --zerodata flag. After the upgrade, the Agent doesn’t come up cleanly. The Agent logs show errors referencing the restart marker file (the file the Agent uses to detect a restart loop), and the Zero Data pods never start.
Cause
Zero Data isn’t supported on rootless installs (see Zero Data Support Matrix). The zerodata package’s post-install actions need root, and applying the upgrade on a rootless host leaves the Agent in an unsupported state.
Solution
Choose one of the following based on your needs:
You want Zero Data: Move the Agent to a root install on a host that meets Zero Data Support Matrix. Re-register the Agent with Alation Cloud Service from the new host.
You want to keep the existing rootless host: Remove the
zerodatapackage and continue running the Agent without Zero Data:sudo yum remove -y zerodata sudo systemctl restart hydra.service
Compose, sampling, and profiling will work without the Zero Data feature.
Diagnostic Tools
The sections below describe general-purpose diagnostic tools you can use while working through any of the problem cases above. They aren’t tied to a specific error.
Check the Query Service Status (Healthcheck)
You can check the health of the Query Service Add-on directly from the Alation UI:
Click on the Settings icon in the top right corner.
The Admin Settings page appears. Under the Platform Settings section, click Agents.
Under the Server Admin section, click Manage Connectors. Then click the Agents tab. The Agents Dashboard appears.
Click the Agent name. Under Query Service, the health status appears.
The healthcheck reports on the following:
Whether the Query Service component is reachable
Whether the Traefik ingress gateway is reachable
Whether the object store bucket is accessible
Inspect K3s Pods on the Agent
When the UI healthcheck reports a problem, drop down to the Agent host to see which pod is unhealthy. The Query Service Add-on runs on a single-node K3s cluster managed by the Agent.
List all pods and their status:
sudo k3s kubectl get pods -A
In a healthy install you should see the following pods in the
Runningstate, all in thealation-defaultnamespace:proxy– routes connector traffic. Always present once thezerodatapackage is installed.jwtgateway– authenticates inbound Zero Data requests. Present once the[ingress]section is configured inhydra.toml.acmandaim– manage cluster state and image lifecycle for Zero Data.queryserviceandzerodatahealth– provided by the Query Service Add-on after you install it from Alation Cloud Service.
If any pod is
Pending,CrashLoopBackOff, orImagePullBackOff, that pod is the place to investigate next.Describe the unhealthy pod to see its events and recent errors:
sudo k3s kubectl describe pod -n <namespace> <pod-name>
Tail the pod’s logs:
sudo k3s kubectl logs -n <namespace> <pod-name> --tail=200
Replace
<namespace>and<pod-name>with the values from the first command. For the JWT gateway specifically:sudo k3s kubectl logs -n alation-default -l app.kubernetes.io/name=jwtgateway --tail=200
Verify Browser Connectivity to the Agent
For Zero Data to work, the user’s browser must be able to reach the Agent’s ingress DNS endpoint directly. This is different from the standard Agent-to-Alation Cloud Service connection.
To verify connectivity:
Check that the Agent’s ingress DNS endpoint resolves from the user’s network. Use a tool such as
digornslookupfrom the user’s machine.Test connectivity to the ingress endpoint using the unauthenticated ping endpoint:
curl https://zerodata.yourcompany.com/_pingReplace
zerodata.yourcompany.comwith your actual ingress hostname. A successful response confirms the ingress is reachable.Ensure that any firewalls or network security groups allow inbound HTTPS (port 443) traffic to the Agent’s ingress endpoint from the user’s network. See Alation’s IP Addresses for Allow Lists for details.
Run Diagnostics
Use the Agent’s built-in diagnostic tool to check the health of the Zero Data components:
kratos diagnostics run > agent_diagnostics.yaml
Send the resulting file to Alation Support if you need assistance troubleshooting the Query Service Add-on.